There’s nothing more important than learning about price charts for a trader ambitious about his/her career. These are the fundamentals upon which all trading information banks. Today, we shall go through the formation of candlestick patterns and the ways by which they can represent opportunities to profit from them.
What are candlesticks in forex?
All Forex charts contain candlesticks. These enable traders to formulate a perception of how the price is moving. This, in turn, tells how one will determine trends, points of entries/exits, and a whole lot more than they can benefit from.
The knowledge of these candlesticks is truly invaluable as it is through them, for the most part, that traders equip themselves to efficiently read price charts. Many find out that through them, they can better identify what the price action is doing compared to other traditional chart forms. Another benefit of such analysis is that the method utilized is the same for every single financial market.
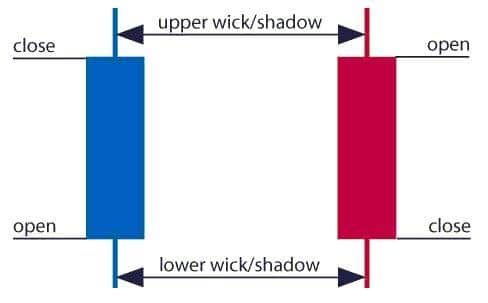
There are three fundamental points that end up creating a candlestick – open, close, and wicks. The shade of it will change to blue or green (based upon the settings) if the closing price is higher than the opening price. Conversely, if the closing price is lower than open, then it will turn red.
Every single candle will represent a day (when on the ‘daily’ setting). The initial price is the open price, while the last of it is the close price. Here is a breakdown of what these terms mean in context.
- Open price. Whilst a novel candle is in its formation, it represents the initial traded price.
- High price. This represents the top of the uppermost wick. When there is no such wick, it is highlighted by the open price of bearish candles or the closing price of a bullish one.
- Low price. This represents the bottom of the lower wick. When there is no such wick, it is the open price of a bullish one or the closing price of a bearish one.
- Close price. Whilst a candle is in the formation process, it is the last traded price.
Candlestick charts vs. traditional charts
Thanks to their highly visual depiction, these chart types have enjoyed wide popularity amongst traders. This has been possible due in no small part to the marking out of the prices for various time periods distinctly compared to other chart types, like a line or a bar chart.
Here are the benefits that traders enjoy when they utilize candlestick charts:
- Easier perception of price movements.
- Easy recognition of patterns and price action.
- Provision of a lot of information (such as the ones mentioned in the previous section).
There are a few drawbacks that need to be kept in mind as well about these charts:
- Color change may end up misleading novice traders into believing that the market may continue in the same direction as the last candle.
- They may end up cluttering the screen as they tend to be more complicated than other traditional chart types.
Forex trading with candlestick charts
Traders utilize such charts to identify points of entry/exit for successful trades. Let’s take a look at some of the points and patterns that can help traders do so.
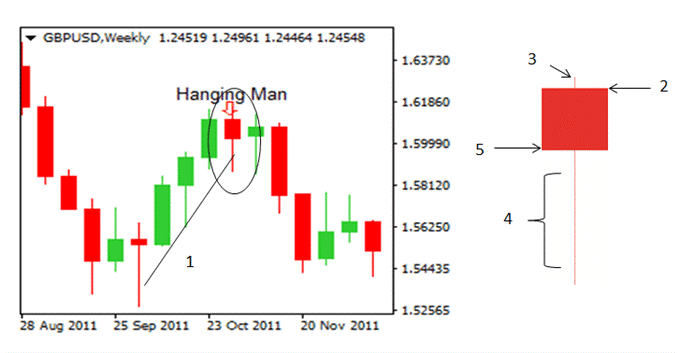
Hanging man
This is one formation that highlights the increment distinctly in the selling pressure at the peak of an uptrend. It comprises a long low wick, a short upper one, a shorter body, and a close under the open.
It ultimately demonstrates a bearish signal, highlighting the continuation of a downtrend. Being open to identify this pattern can enable one to figure out the entry/exit signals.
Shooting star
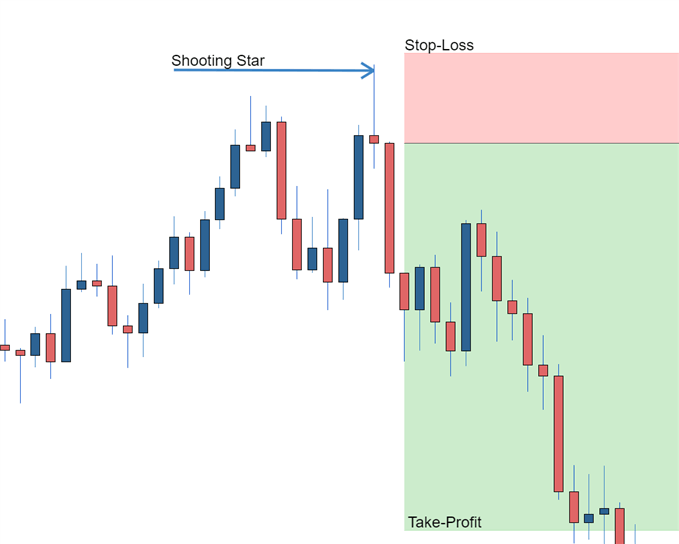
Like the previous formation, this one demonstrates a bearish reversal, comprising a wick half the size of the candle. This means that there is more selling going on than buying. It indicates a short entry or a long exit.
Once the candle closes, one can execute a short trade soon after. A stop-loss can be placed above the candle with special emphasis on ensuring a positive risk-reward outcome that has been demonstrative of successful trades.
Hammer
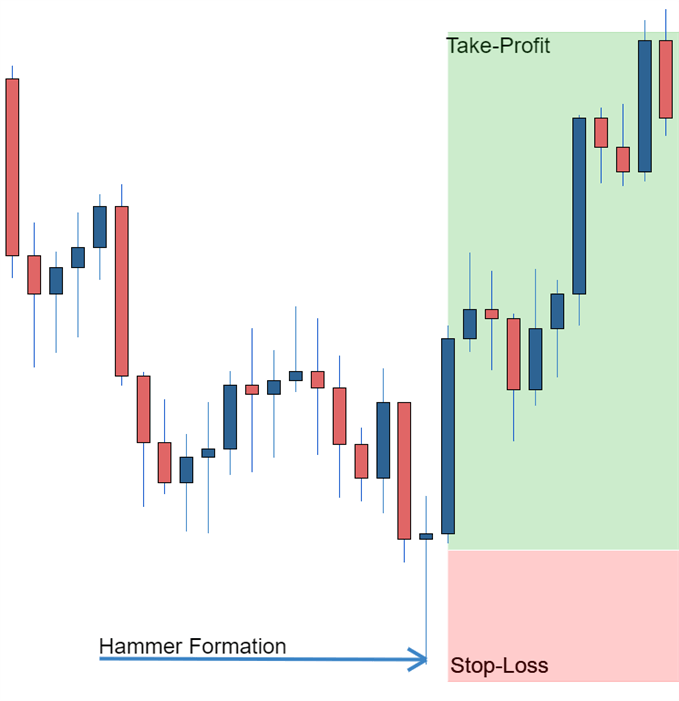
This formation is the very opposite of the previous one. As a bullish reversal candle, it comprises a long wick and a short body. It is utilized for a long entry or a short exit. As shown below, this formation is used for entering long trades. It is advisable to place the stop-loss under the candle formation and take profit at a level that again ensures a positive risk-reward outcome.
Bullish/bearish engulfing
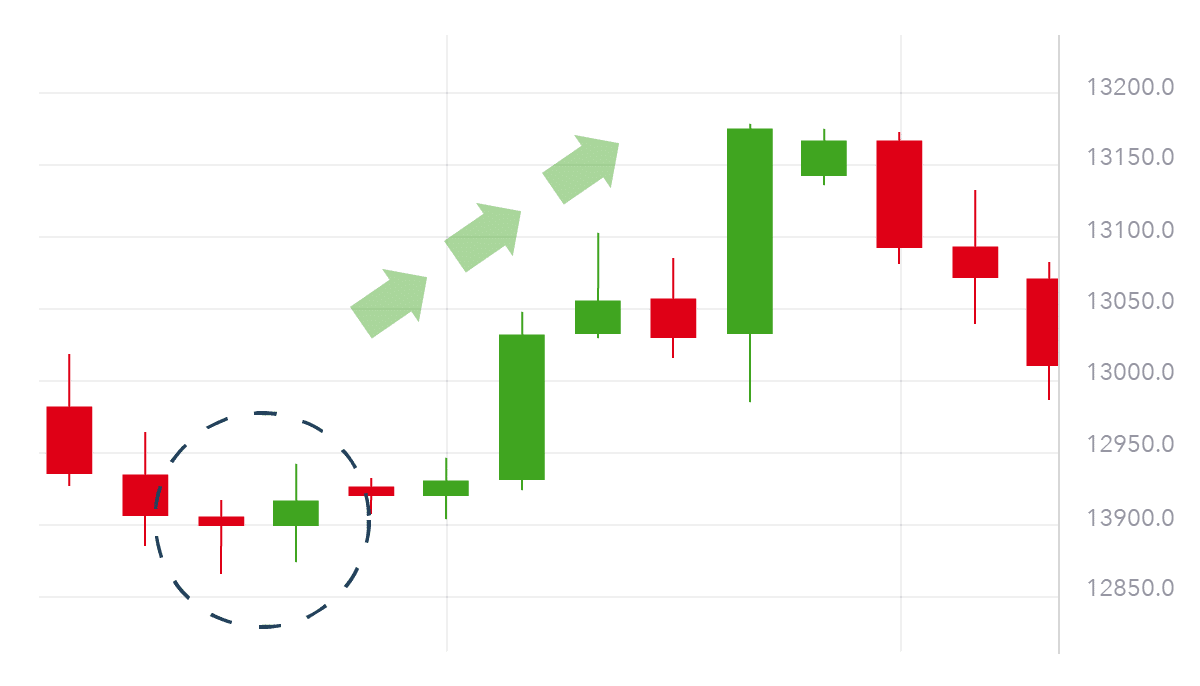
A bullish engulfing formation occurs in downtrends with its characteristic short red candle adjacent to a large green one. These tell us that the market is dominated by buyers. One should ideally go long to benefit from the reversal or close out short positions.
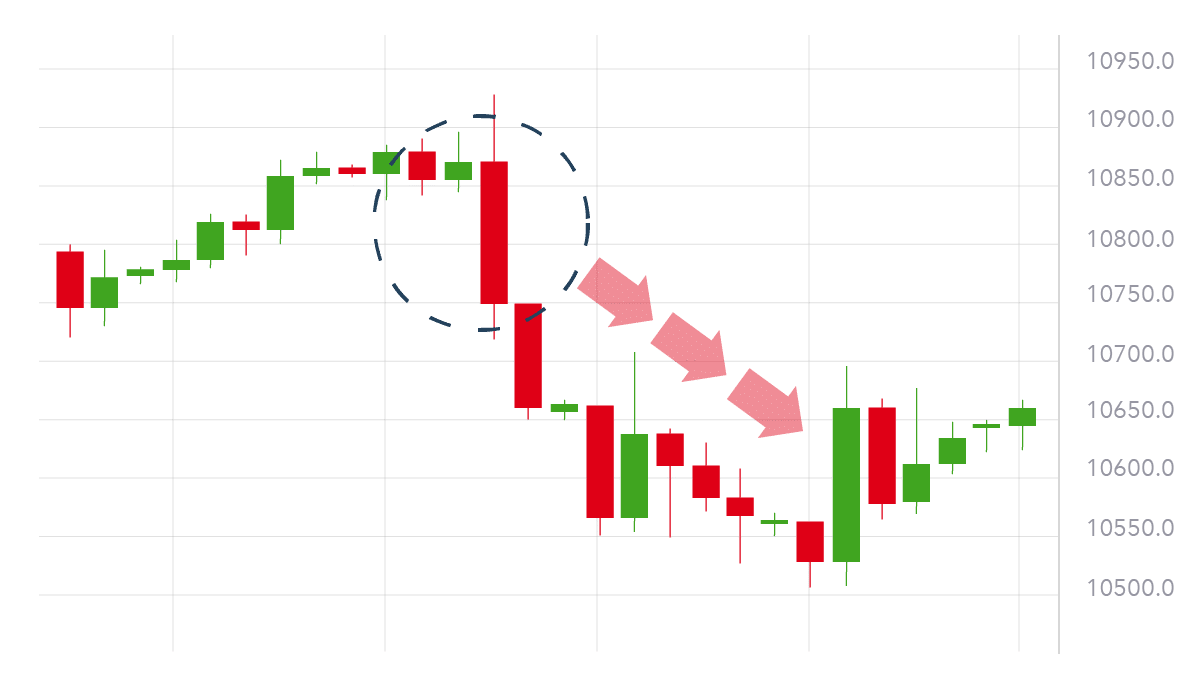
On the other hand, a bearish engulfing formation is the very opposite. It consists of a shorter green candle that is fully engulfed by the red one next to it. This highlights that the market is on the cusp of entering a downward trend. One should ideally short-sell the market or close the long positions out.
Piercing line
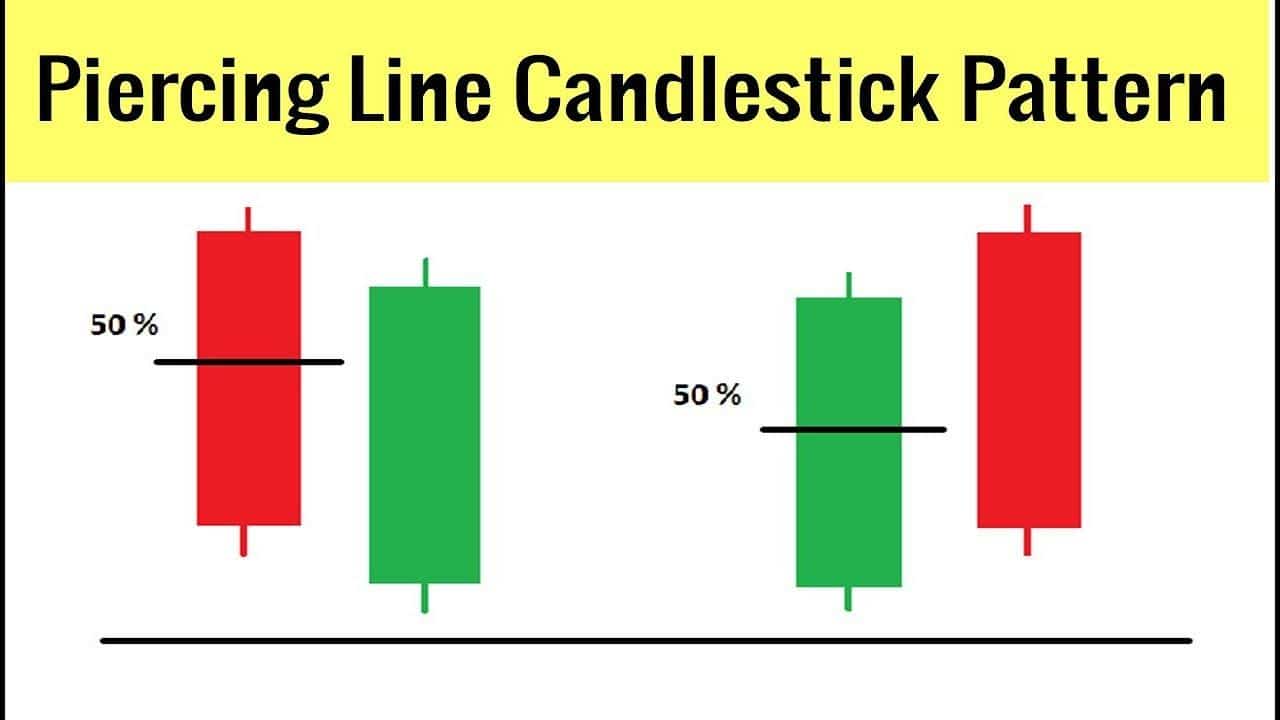
This formation is a bullish reversal pattern that consists of two candles – a long black one followed immediately by a white one, which opens below the previous ones close. The existing buying pressure soon forces the price more than halfway (usually about two-thirds of the way) into the actual black candle body.
Summing Up
Candlestick formations should be utilized like any other analytical tool, that is, to understand the mindset of other players in the market. This provides an additional level of analysis above and beyond what other forms of analysis offer to dictate trade decisions.