Aroon Indicator is a technical analysis tool that provides valuable information on whether a currency pair is trending or not. In addition, it provides insights into the strength of the underlying trend.
Consequently, it is commonly used to detect when trends are about to emerge after long periods of consolidation. In some cases, it is used to spot potential levels of price reversals after the price has moved significantly in a given direction. It stands out partly because it ascertains how long it has taken for the price to clock a new high or low.
Interpretation
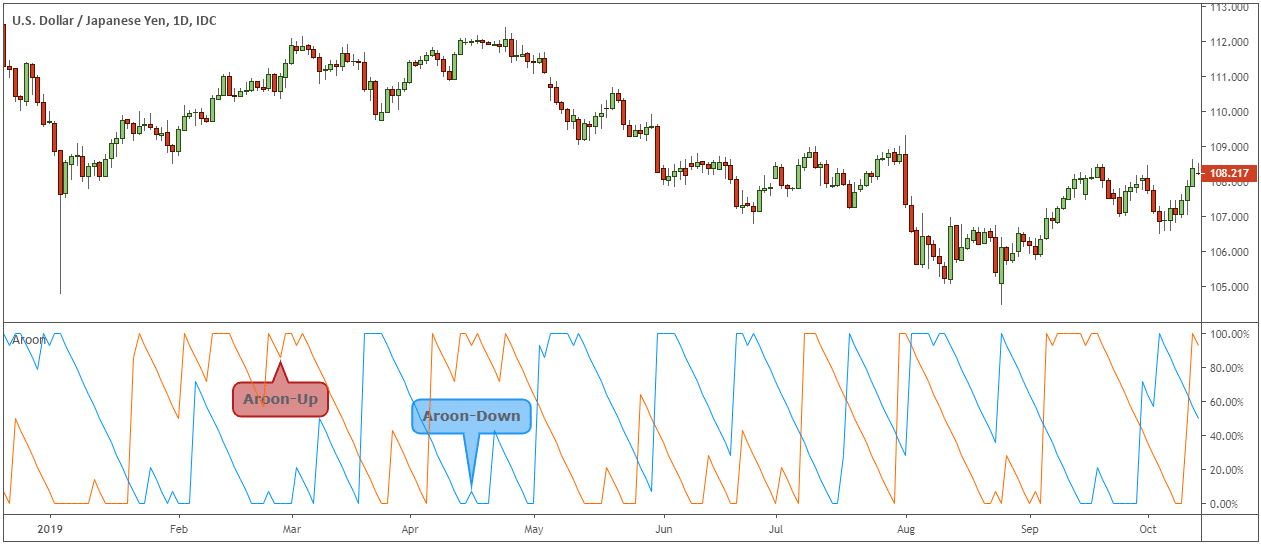
The oscillator is made up of two indicators. The Aroon Up is used to ascertain how long it has taken before the price clocked a 25 day high. The higher its reading expressed as a percentage, the stronger the underlying trend. When its reading is above 50 it implies that the price is likely to continue making higher highs on a buildup in buying pressure.

Likewise, the Aroon Down calculates the number of days it takes before the price reaches a 25-day low. Whenever, its readings are above 50, it implies that the price is likely to move lower and register lower lows. The higher the reading expressed as a percentage, the higher the prospects of price tanking as it affirms a buildup in selling pressure.
Trading signals
Trading signals emerge depending on how the two indicators oscillate. For starters, whenever the Aroon Up is above 50 and Aroon Down below 50, it implies market participants are piling buying pressure, and that price is likely to continue moving up.
Similarly, bearish momentum signaling price is likely to continue registering lower lows when the Aroon Down is above 50 while Aroon Up continues to edge lower below the 50 level.
A sign for a new trend emerges whenever the Up line of the indicator crosses the Down line and moves up. The same acts as a warning sign that momentum has shifted to the upside and that traders should only eye long trades. The strength of the uptrend is confirmed with the Up line moving above the middle line.
Likewise, it becomes increasingly clear that it is time to eye short positions whenever the Aroon Down crosses the Aroon Up and moves above the middle 50 line. The crossover implies building bearish pressure.
Periods of consolidation are quite common in the forex market. Consequently, whenever both the up and Down lines are below 50 and moving in parallel, it implies the market is not trending. In this case, price is likely to trade in a tight trading range oscillating between support and resistance levels.
Conversely, traders can use this opportunity to buy at support and exit at resistance levels or sell at resistance and exit at support until there is a breakout from the trading range.
Breakout strategy
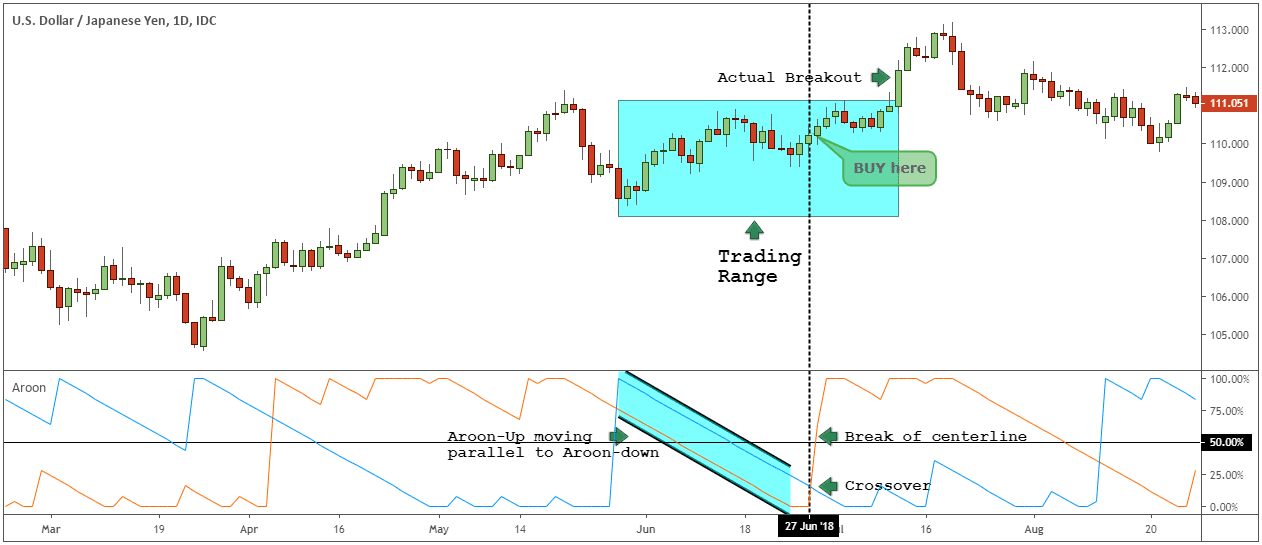
Breakouts occur after long periods of consolidation whereby no new highs or lows are generated, with prices oscillating between support and resistance levels. Consolidation becomes evident whenever the Aroon Up and Down are parallel, as shown below.

An early indication that price is about to break out of the range and move up or down occurs when the two are no longer parallel. In the chart above, it is clear that price moved up as soon as the Aroon Up crossed the Aroon Down and moved up, crossing the middle line.
The fact that the crossover occurs much earlier before the breakout offers an ideal opportunity to enter a long trade much earlier.
Aroon indicator Moving Average strategy
An indicator is most effective when used in combination with other technical analysis tools to validate a trading decision. With this strategy, a 200-day Moving Average is used to verify the underlying trend and the appropriate trade to open.

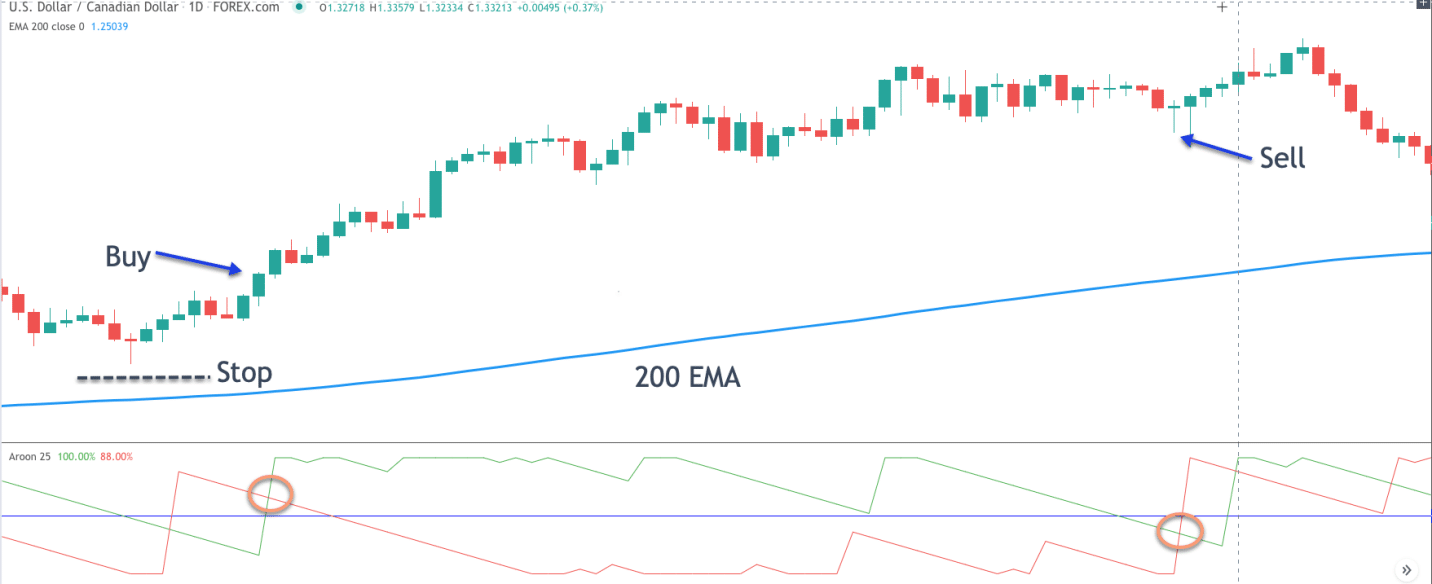
In the USDCAD chart above, in the first phase, the price was in consolidation mode as both the up and Down lines of the indicator were parallel and edging lower. A buy signal is triggered as soon as the Up line crosses the Down line, signaling buyers are increasingly flocking the market.
The fact that the price is above the 200 EMA affirms the market is in an uptrend and that ideal trades will be the buy positions. As long as the Up line of the Aroon indicator is above the 50 line and the Down line is below 50, the market is trending up, and smart bets will be on buy positions on small pullbacks.
A stop-loss can be placed slightly below the entry point to shield against market correcting and starting to edge lower.
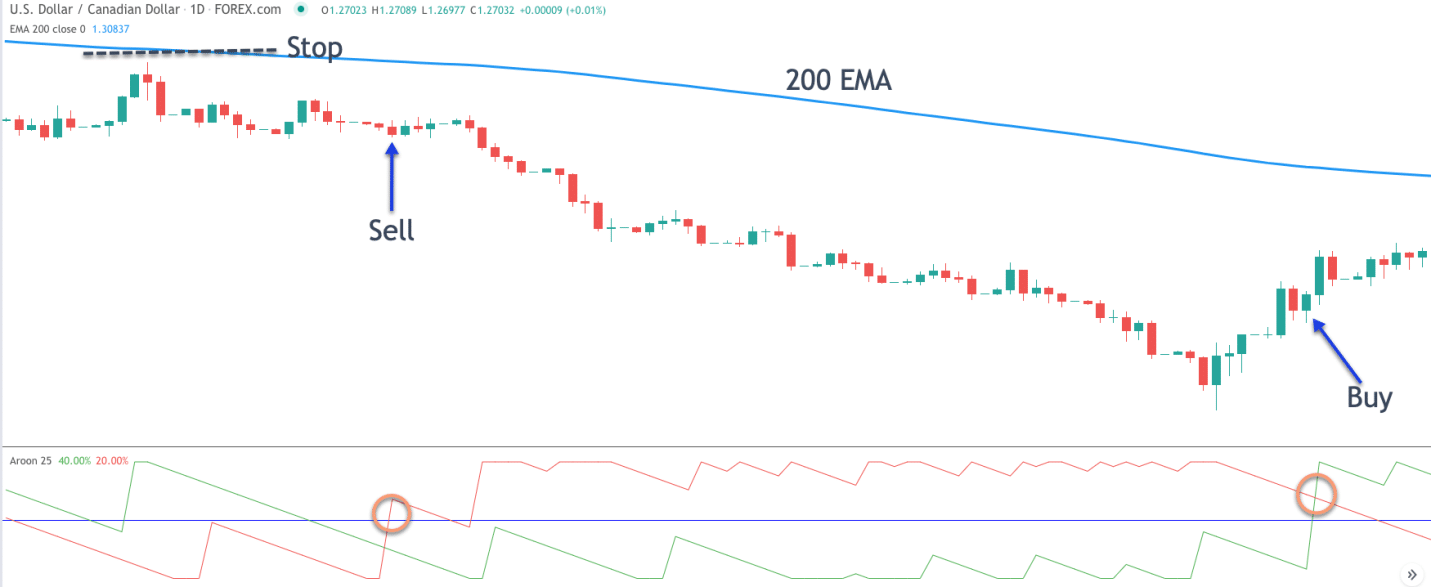
Similarly, short positions can be eyed whenever the price is below the 200 EMA as this affirms bears are in control and likely to continue pushing prices lower.

In the chart above, a sell signal comes into play whenever the Down line of the Aroon indicator crosses the Up line and starts edging higher. The Down line crossing the 50 level affirms a buildup in bearish pressure. In this case, one can look to open short positions as soon as the price pulls back from the downtrend.
Aroon indicator drawbacks
Like any other technical analysis tool, it should never be used in isolation as it often gives false signals. During periods of extreme levels of volatility, the tool also experiences wild swings moving up and down the 50 level. Therefore, it becomes extremely difficult to pinpoint the exact direction the market is moving and the strength of the underlying trend.
Additionally, the indicator can provide an accurate trading signal when the price has moved significantly. For instance, it could provide a buy signal when the price has moved up significantly, making it risky to buy at a high, or provide a sell signal when the price has tanked significantly, making it riskier to sell at a low.