The McClellan Summation Indicator (MSI) is a technical tool that was created to help investors and traders understand the state of the financial market. It belongs to a category of indicators known as breadth because they look at how stocks in an index are doing.
The idea behind these tools is simple. For example, if you are looking at the S&P 500 index, you could get more information about it if you find out that most stocks are in a downward trend. In this article, we will look at what the McClellan Summation Indicator is and how traders can use it in forex trading.
What is the McClellan Summation Indicator?
The MSI is derived from adding the values gotten in the McClellan Oscillator (MO) indicator.
Therefore, to have a good understanding of it, it is essential to first know how the MO is calculated. MO is got by first looking at the number of stocks in an index or exchange that are gaining and those that are falling.
While the MO is popular, it has some key gaps because of how indices like the S&P 500 and Dow Jones are calculated. For one, all companies in the S&P 500 have different weightings. Apple and Microsoft account for about 12% of the total index because of their size.
Other big companies that influence its movement are firms like Amazon, Alphabet, Tesla, and Nvidia. Therefore, it is possible for the S&P 500 to rise when these companies are growing while the rest are dropping.
The McClellan oscillator is calculated by conducting a summation of the figures calculated in the MO total. Therefore, its formula is the addition of the previous day’s index and the current day Mcclellan oscillator. When applied to a chart, the index is made up of a neutral line and positive. In most cases, when there is a strong bearish market, the MSI will be in the red zone and vice versa.

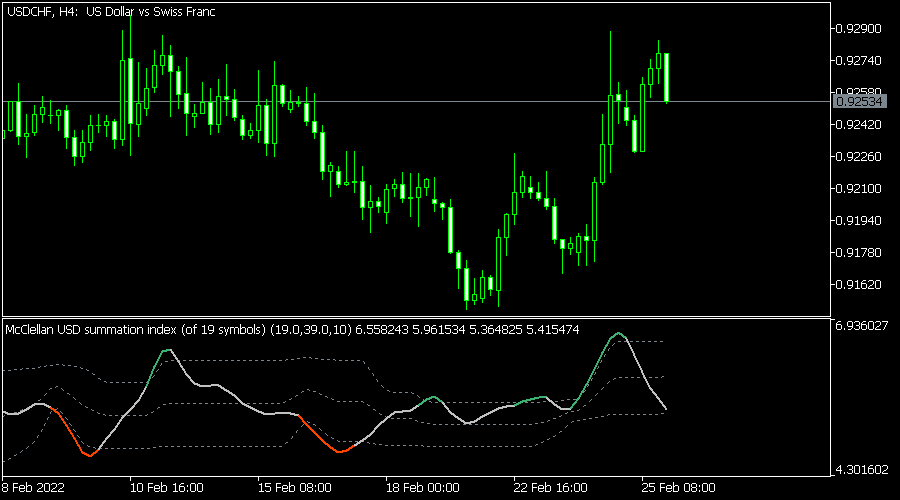
The chart above shows what the McClellan Summation Indicator looks like on the USDCHF pair.
Stocks and forex relationship
A common question is whether the McClellan Summation Index can be used in forex trading because it was developed to target stock traders.
The answer is that it is possible to use the tool because of the close relationship that exists between stocks and currencies.
A good example of this is seen when you consider the fact that American stocks have a fundamental relationship with the US dollar. For example, in 2020, the US dollar rose sharply after the World Health Organization (WHO) declared Covid-19 a global pandemic. At the same time, stocks declined as investors assessed risks to the economy.
In the months that followed, the US dollar declined, while stocks jumped as investors embraced a risk-on sentiment because of the expansionary Federal Reserve.
The same relationship can be seen in many trading days. In most cases, the US dollar tends to decline when the US indices are rising.
Install McClellan Summation Index in MT5
While there is a relationship between stocks and currencies, the fact is that the MSI is not the best tool to use to analyze currency pairs. Instead, traders should mostly use the indicator to learn more about the state of the market.
As you will find out, the McClellan Summation Index is not pre-installed in the MetaTrader 4 and 5 applications. Therefore, you need to install it manually or use a trading platform like TradingView that offers the indicator.
If you are using the MT4 or MT5, you will first need to download it from the MQL 5 or 4 marketplaces. You can access it by just doing a simple Google search. You should then download the script and save it in the indicators folder. The simplest way to access the folder is to go to File followed by Open Data Folder. After saving the indicator, you can then access it by going to Insert, Indicators, and Custom.
How to use the McClellan Summation Index in forex
There are several approaches to using the McClellan Summation Index in forex trading. Like other oscillators, you can use it in trend following. The trend-following strategy refers to a situation where you find a currency pair that is moving in a certain direction and then follow it. The trader’s goal is to exit the trade when they sense that the trend is changing.
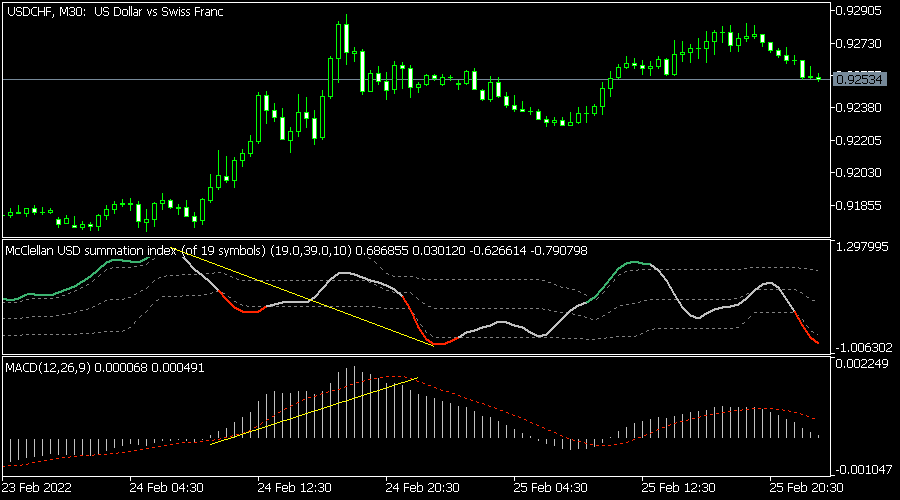
While some analysts believe that the MSI can be used well in trend-following, the reality is that it does not work well in this strategy. A good example of this is in the chart below. On the lower side, we have the MACD.
As you can see, the MACD typically surges when the USDCHF pair is moving upwards. The McClellan Summation Index moves in the opposite direction when the pair is rising. This may be because the MSI uses data from stocks instead of currencies.

Another approach that people use the McClellan Summation Index in forex is to find divergences. A divergence happens when an indicator is moving in an upward or downward trend while the price is moving in the opposite direction.
Summary
The MSI indicator is a popular tool used in the stock market. While many traders use it in the forex market, in our experience, it does not seem to work well. Still, there are many popular oscillators that you can use to substitute the indicator. The best is the MACD, Stochastic Oscillator, and the Relative Strength Index (RSI).