Trading actions taken based on the strength of price movements are known as momentum trading. It is based on the theory that upward price movement will continue with enough demand behind it.
When an asset’s price increases, investors and traders become more interested in it, resulting in rising prices. As long as a significant number of sellers enter the market, the price may shift unpredictably when unknown developments occur. As the number of sellers increases, the current trend will change, causing asset prices to decline.
Traders who use momentum look for strong trends and enter into strategic positions to benefit from the expected changes in price. They then close their positions once the trend begins to lose its strength. It is not a must that momentum traders have to find tops and bottoms in trends; rather, they can monitor the main trends. It aims to capitalize on herd mentality and market sentiment because traders make decisions based on what the crowd is doing.
The strategy is based on the following critical elements:
- Trading volume
- Market volatility
- Time frame
Trading volume
The amount of transaction volume can be described as the number of unique assets that change hands in a certain period. Think of it this way: It looks like one buyer purchased five assets when five buyers each buy one asset. Thus, the total volume of their trading would be ten assets.
Momentum traders must be able to enter and exit positions quickly because trading volume is essential for them. In a liquid market, it is easier to exchange assets for cash because of many buyers and sellers. The liquidity of a market is low when it has few buyers and sellers.
Market volatility
Momentum traders have a good chance of increasing their profit margins in volatile markets. Volatility is the degree to which the price of an asset changes. Generally, markets with higher levels of volatility have a greater degree of price fluctuation, while markets with lower levels of volatility have less price fluctuation.
Traders looking to take advantage of short-term increases and decreases in asset values will look to volatile markets.
The biggest risk of momentum trading is that the market may sometimes move against you within a short time. Implementing sound risk management strategies is imperative to protect your balance from price volatility and minimize the risk. Some of the critical factors that should be integrated here include stop losses and take profit orders.
Time frame
Markets are a particularly fluid place, making momentum trading strategies popular. However, each transaction will have a different duration based on how long the trend continues. Additionally, long-term traders, such as position traders, and short-term traders, such as scalpers, can use this principle.
Momentum indicators
A momentum trader does not pay much attention to the long-term growth prospects or the surrounding economic environment of the underlying asset. Traders who place trades based on price action are generally called momentum traders.
Most of them rely on technical analysis and indicators to decide when to enter and exit each trade because that allows them to control their position size.
Some of the most commonly used momentum indicators include:
- The Momentum indicator
- Relative Strength Index (RSI)
- Moving averages
- The stochastic oscillator
Momentum indicator
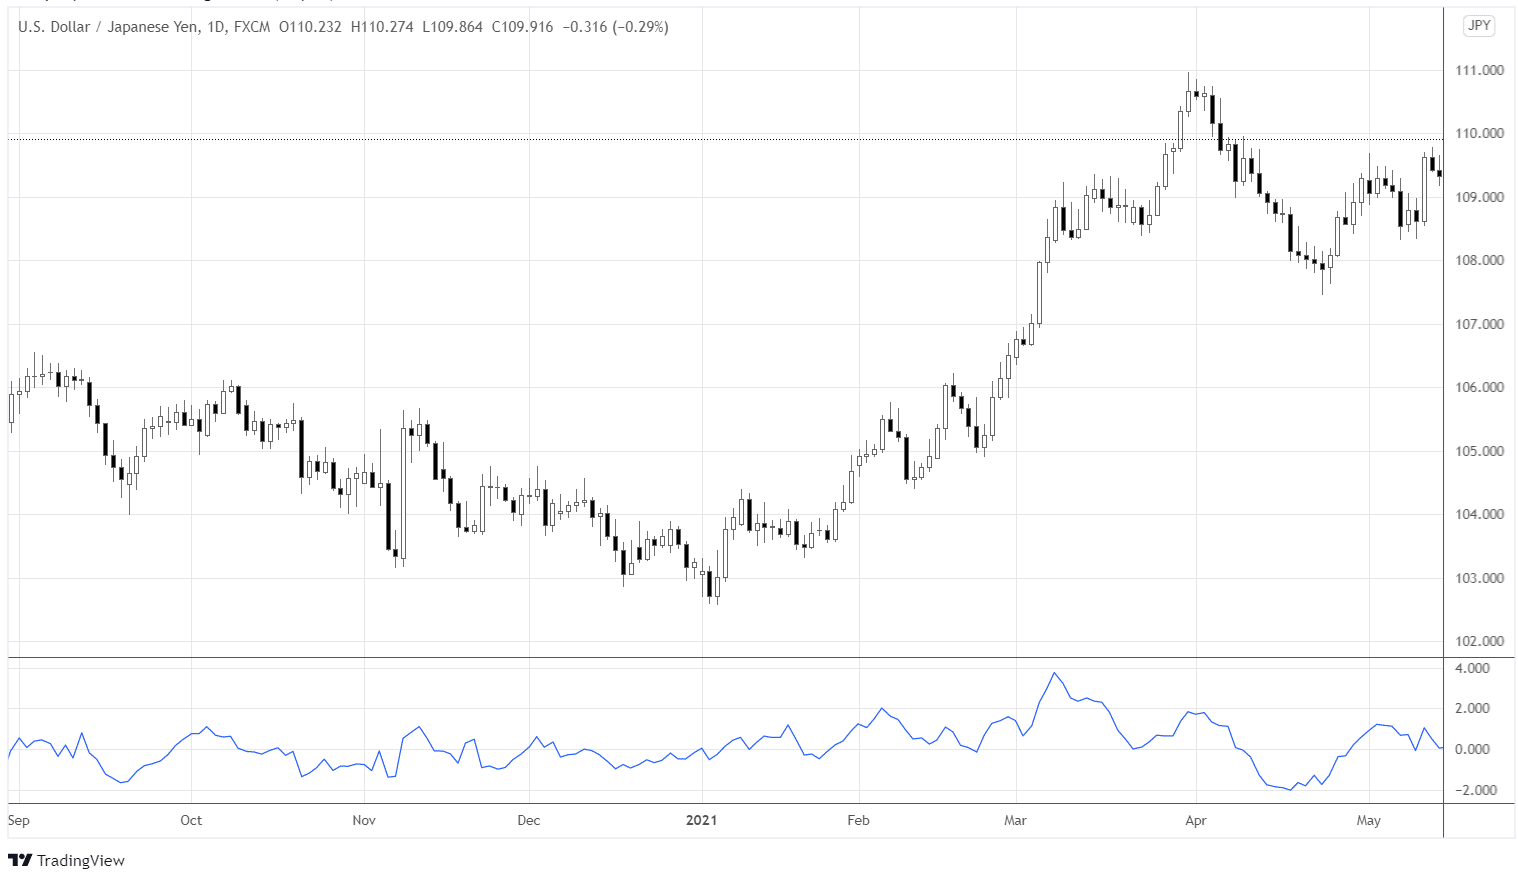
This indicator is a single-line moving indicator as it moves down and up on the chart. When we use it to examine momentum, we can see whether it is changing or the current trend. This indicator can also be used to detect strategy inconsistencies.

You can also continue on from where you previously left off. You should buy when the indicator crosses above the zero line; when the momentum indicator crosses below the zero line, you should sell.
Moving averages
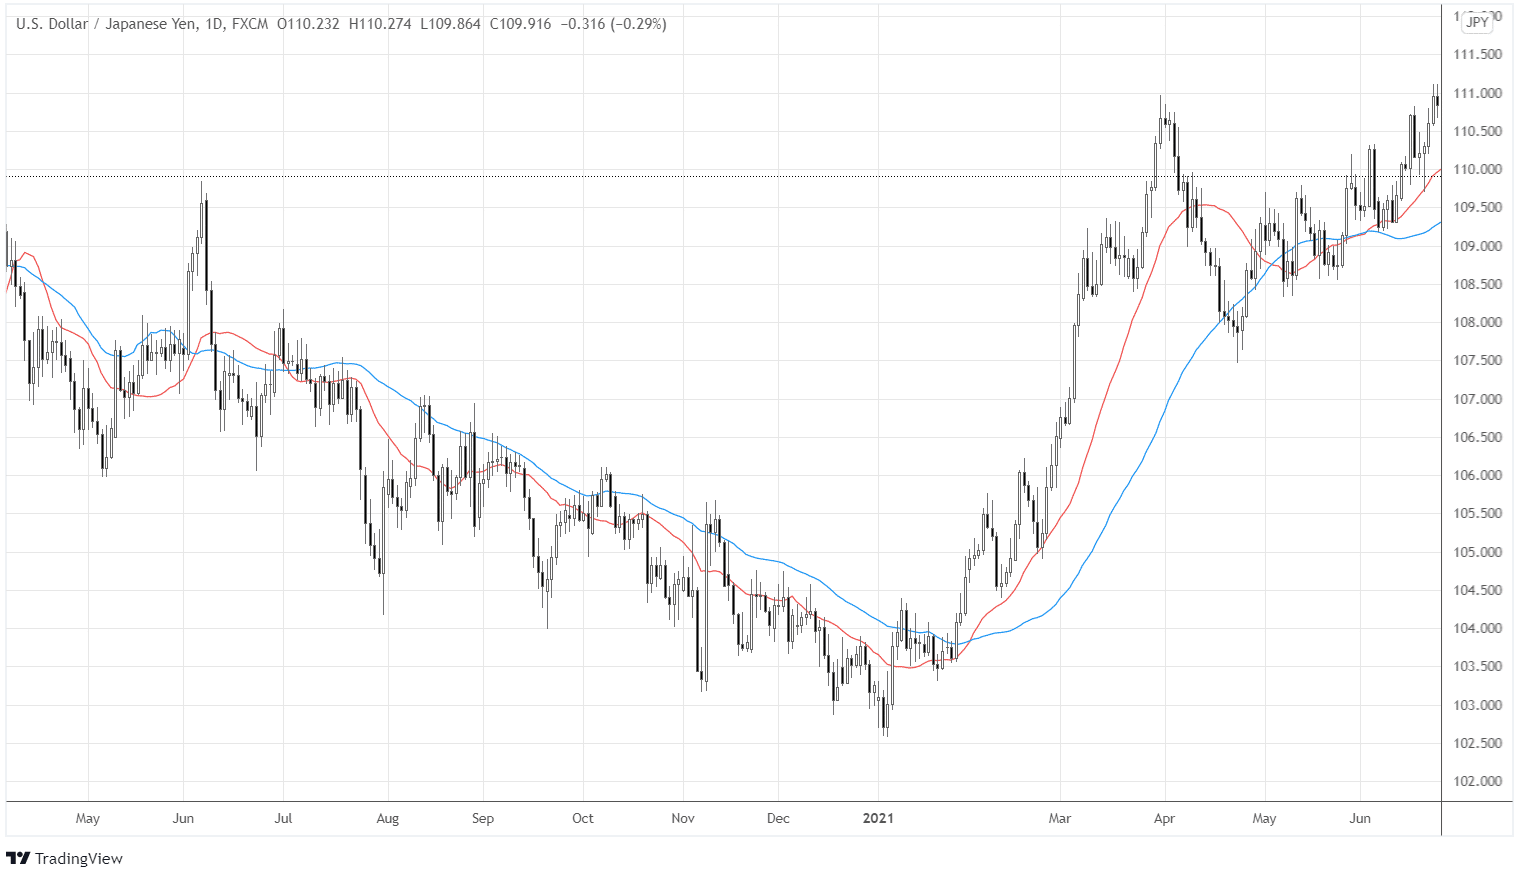
A Moving Average can help you spot trends by eliminating day-to-day fluctuations and other irrelevant deviations in the market.
You can see two MAs in the chart below: the 50-day blue one and the 25-day red one.

An MA line can be applied to different timeframes and is useful for predicting whether the trend is gaining momentum. A shift from a bearish to bullish trend is indicated when the Moving Averages cross. For example, in the chart above, some of the spots of the MA crossovers correspond with the change of a major trend.
Relative Strength Index (RSI)
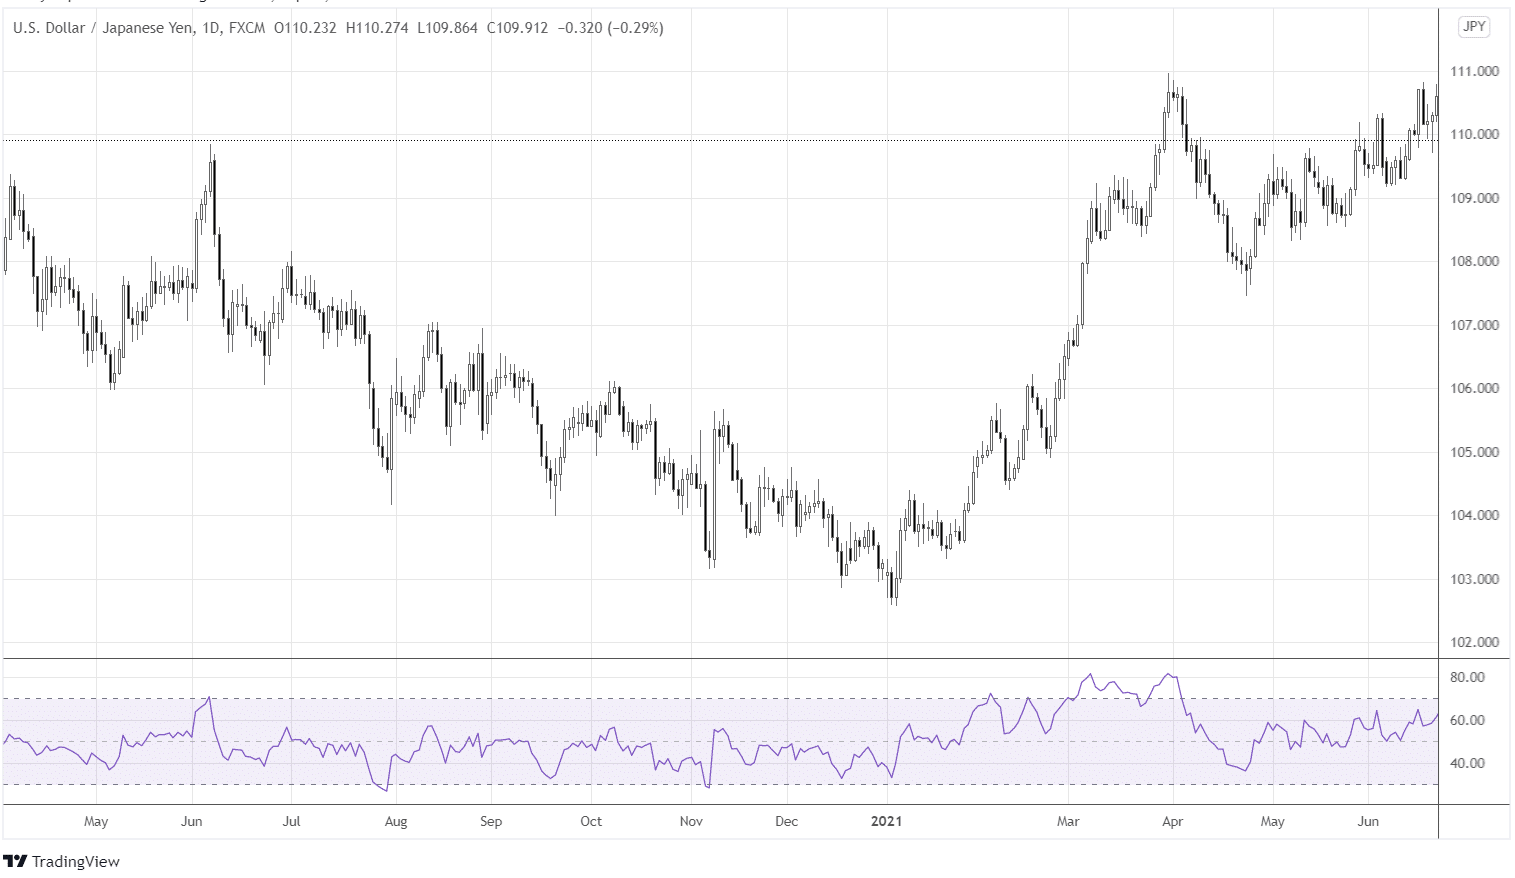
The RSI measures the level of buy and sell pressure in the market and uses that information to enter and exit positions. That said, trading by swinging between 0 and 100 would enable you to predict buying and selling opportunities accordingly.

A currency pair is considered oversold if the market is convinced that the price will continue to go down, and an overbought condition occurs when the market believes that the price will continue to rise.
The Stochastic Oscillator
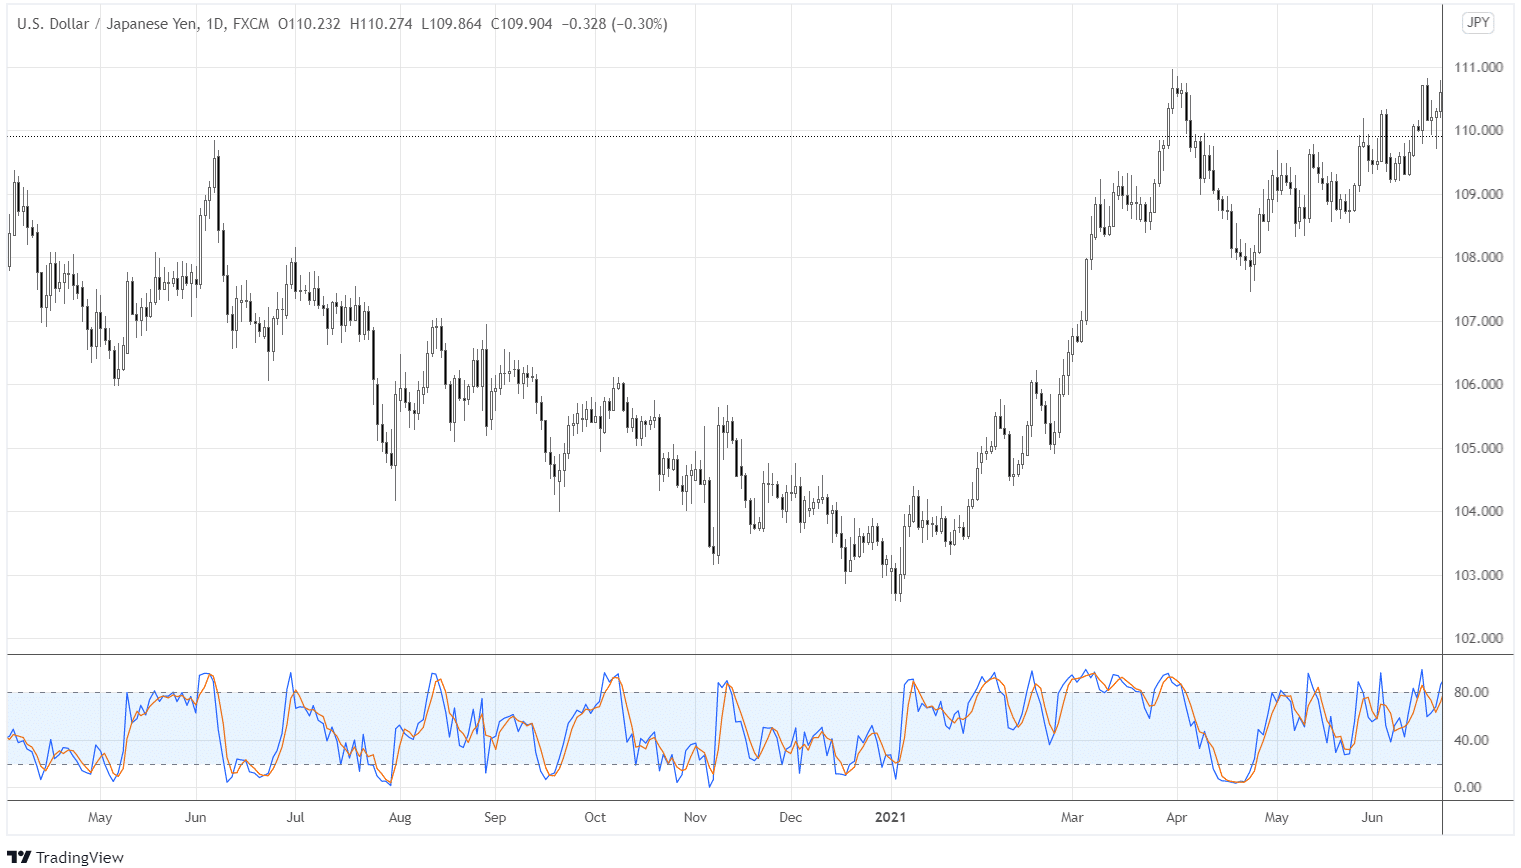
A stochastic oscillator measures the underlying market’s speed by tracking the most recent closing price and comparing it to the price range that preceded it. Based on these findings, it is highly useful for predicting changes in prices.

A stochastic oscillator is represented by two horizontal lines on a chart: the indicator line and the signal line.
The indicator line oscillates in a range of 0 to 100. With this indicator, a reading above 80 indicates that the asset has been overbought. The asset is considered oversold when the reading goes below 20. The signal line will alert the trader if the signal line’s direction changes.
If the Stochastic indicator heads back to 20, the trend will likely continue to rise, even if a correction occurs.
In summary
The momentum strategy is relatively easy to learn and apply. However, it should be noted that the market will often turn against you even when you least expect it. Therefore, stick to your rules, use the appropriate indicators and apply proper risk management.