Trading signals are trades sent out by amateur or professional traders so that others can follow and profit from their executions. Some participants can employ their expert advisors onto the charts and then share their trades through social media platforms such as Facebook, Telegram, and WhatsApp. The market is crowded with bogus services that promise a 100% return a month while charging hundreds of dollars. These signal providers only result in introducing margin calls on your accounts.
MQL5 is made available by the MetaTrader corp and offers one of the most reputable signal services. The industry-standard financial platform allows you to subscribe to any service of your choice and copies all the orders from the source directly. It is possible to select a profitable system if a trader can scan the provider’s statistics. Our article will cover the crucial points you should follow to filter and read signal services’ performance on the MQL5 platform.
Filtering signal at MQL5
After visiting the signals page at MQL5, you can see tons of different providers at both MT4 and 5 platforms. There are many filter options, including reliability, maximum profit, reviews, initial deposit, trading time in a week, subscribers, and subscription fees. However, the most vital ones you should look at are the drawdown and the percentage profit per month. See what kind of broker the provider trades at, as your choice might be different.
Reading signals
Clicking on the specific seller will lead you to their statistics page, where each of them presents the relevant information in a detailed manner.
First of all, you can begin by looking at the web and the graph located side by side. The former provides basic information about the drawdown, while the latter can explain how the balance curve is going.
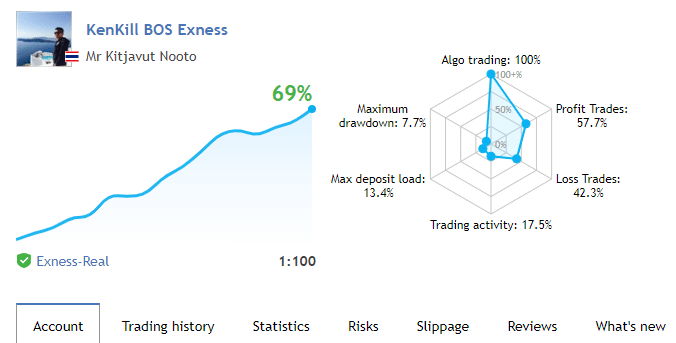
Image 1. The graph shows 69% overall growth. You can see vital information such as max drawdown, trading type, percentage profitability, etc., within seconds on the web.
A growth chart is not the only tool to assess the balance and equity curve. Three other graphs on the same page can give customized information on withdrawals, growth percentage each month, and drawdowns. By looking at them, you can immediately realize if the trader uses EAs or a strategy that doesn’t involve stop losses or utilizes grid or martingale. Such a figure will show sharp drops in equity.
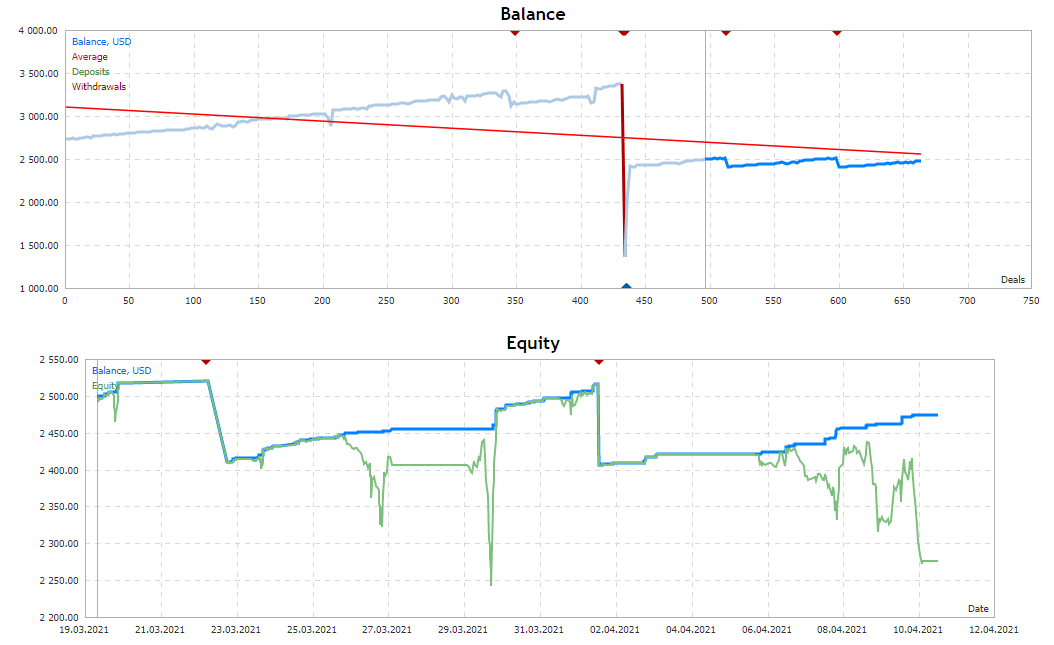
Image 2. The green color highlights the equity curve. If it separates from the balance and drops beneath it, you should get the red signal that a risky strategy is used.
To remove all the fluff and see if the signals will be beneficial for you, note the average holding time of each trade and the slippage tab. If the duration for which the positions are open is less than a minute, it indicates a scalping strategy. Copying such signals is fine as long as there is no delay in mimicking the source, which you can confirm using the slippage tab. As the trades’ latency increases, the difference in exit and entry will become wide, making copy trading useless.
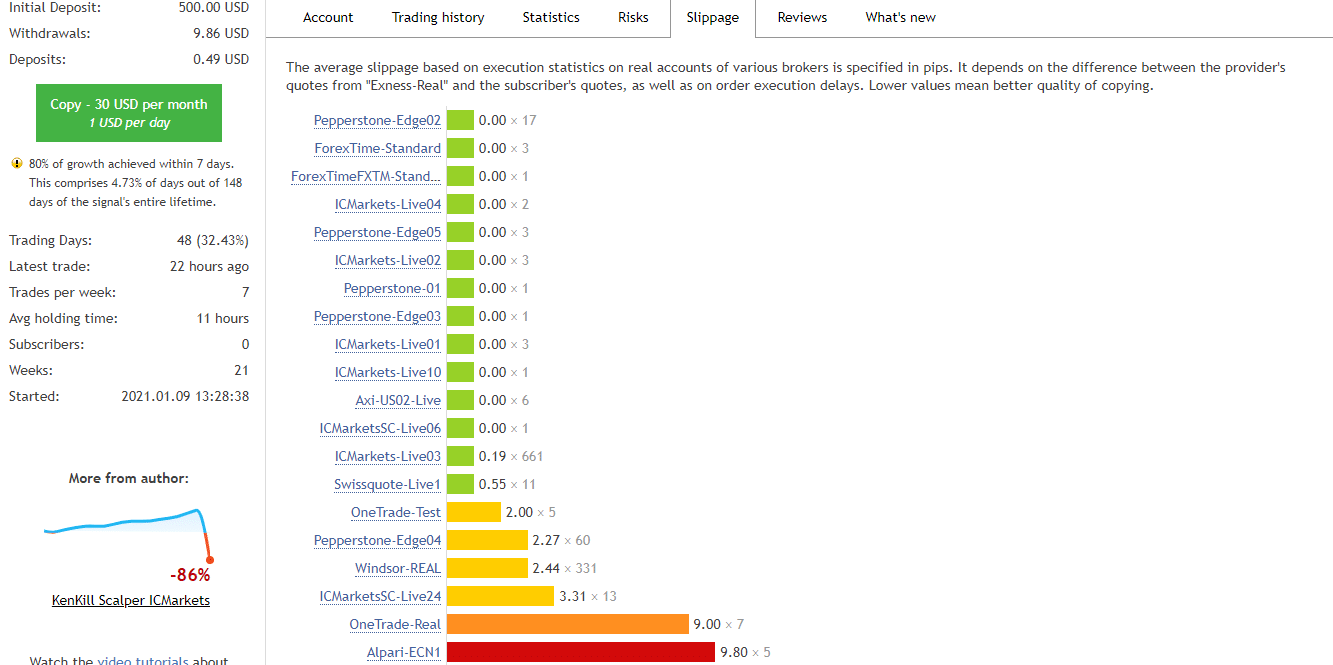
Image 3. You can see the latency of different brokers concerning the providers. Alpari ECN 1 at the bottom shows a delay of 9.8 points or 0.98 pips. Use the exchanges that are highlighted in the green for best copy trading.
Trading history includes all the trades that a signal seller places for the duration of its uptime. You can note the entry/exit time, type, volume, symbol, price, stop loss, take profit, commissions, swap, profit, and comments. A trade can use all this information to see if the system has solid risk management and if the profitability matches the charts’ results.
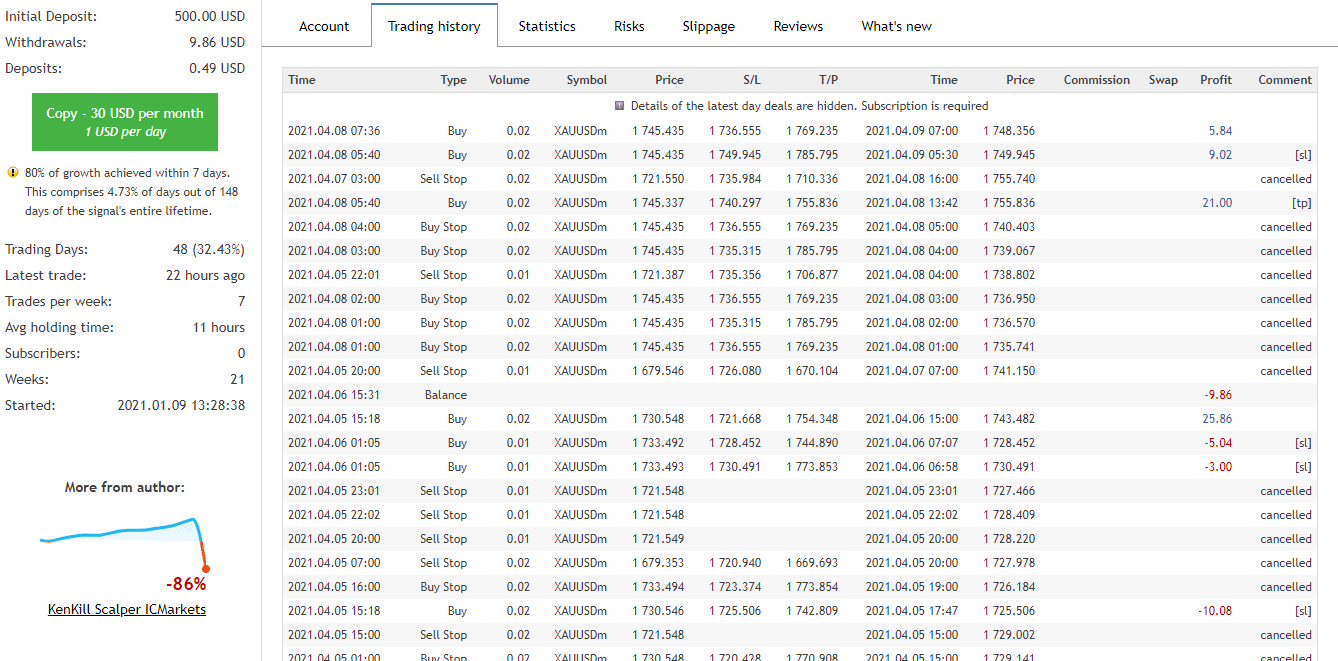
Image 4. This signal provider trades on gold and uses martingale as the lot size increases on each loss. He also has proper stop losses and uses trailing stops as few profitable orders have S/L in comments.
The statistics tab holds a good amount of information on the web graph that we previously mentioned. It is the best option for understanding all the performance analyses. Even if you ignore all the other graphs and sections, this portion alone has the key to everything you need to know regarding a signal provider.
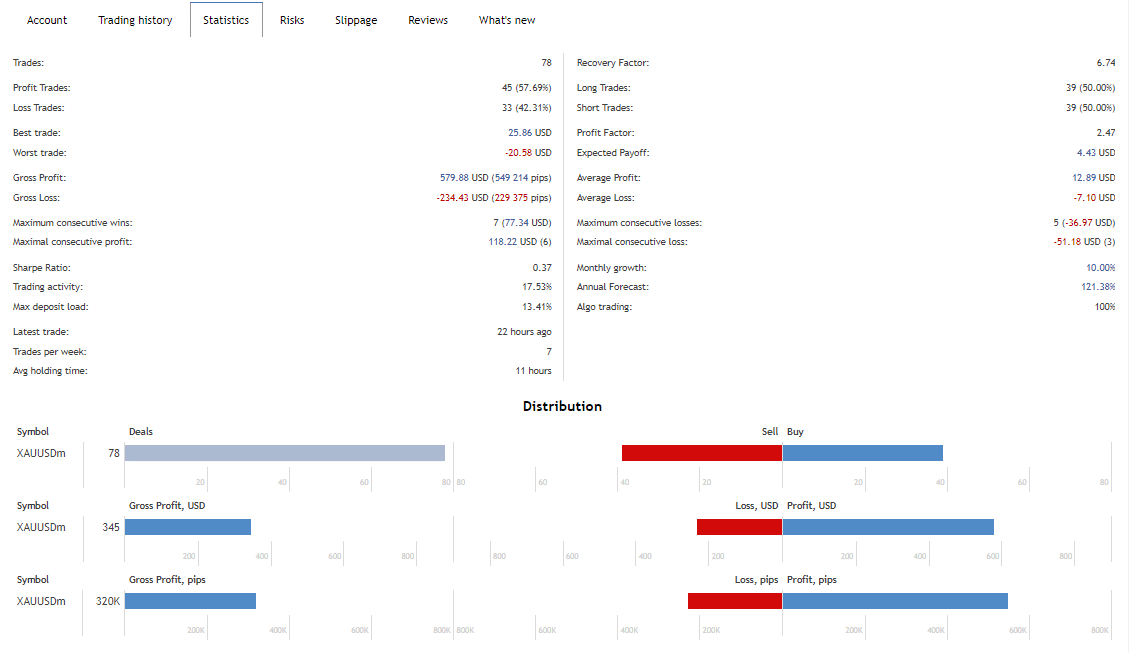
Image 5. The statistics section has no trades, profitability, drawdowns, average losses, annual forecasts, etc.
To become a pro at determining signal profitability, see what is highlighted under the new tabs. There you will find any prior warnings the system had or any new ones that it holds. They can be anything from red signals about huge drawdowns to a fresh account.
Reliability bars, followers, allocated funds, and customer reviews are not to be sidelined. Try to keep the same instrument that a service provider has and use the same amount of leverage to match the trade size accordingly. Exceeding your own margin will not result in larger lot sizes.
End of the line
MQL 5 signals can vary in cost from $30 up to $1000. However, keep in mind that paying more money or seeing high percentage returns does not mean the service is better. It would be best to note all the essential points mentioned above to stand a good chance at copy trading. Also, test out the signals on a demo account before proceeding to a live one. A trader can decide to allocate a portion of his funds to the system for reducing further risks.