Stochastic oscillator is a key oscillator that has been known since the mid-fifties of the last century. Many traders use this element to successfully trade in financial markets due to its accurate display of overbought and oversold zones. Today we will analyze all the main nuances of trading and master the parameters of this oscillator.
What is Stochastic oscillator
This indicator is ranked among the most popular among traders. Most newcomers start learning strategies on the basis of this oscillator. Stochastic shows overbought and oversold zones on charts. Zones of twenty and eighty percent are taken as the basis.
The indicator distorts the vertical axis of prices and shows statistics in percent. Traders can see a certain corridor along which the price moves during trading sessions. As soon as the price rises or falls to the borders of the corridor, there is a high probability of a reversal.
This oscillator is formed on the basis of the previous data of Japanese candles. The indicator determines the minimum and maximum price jumps. Traders use this element to trade in a calm market or with trend movements. To trade on the market, Stochastic is complemented by other indicators and support/resistance lines for more accurate signals to enter the market.
Like all similar trading tools, this oscillator shows the previous price movement, but does not predict the exact jump in the rate. Traders use this to identify market trends and entry opportunities. Best of all, the indicator shows itself on the H1-H5 timeframe, since traders can cut off the noise on the chart and increase the accuracy of transactions.
History of Stochastic oscillator
Stochastic is an oscillator showing the position of the current price of an analyzed financial instrument relative to the range of a certain price period in the past. It is assumed that if the trend is upward, then the current price should be somewhere in the range of previous highs, if the trend is downward, then in the area of previous lows.
Professional traders say that when creating this oscillator, a number of formulas were used starting with% A,% B,% C, etc. As a result, after testing (running in) the indicator in practice, only% K and% D remained in stochastic, and they proved themselves to be the best.
It is believed that George Lane is one of the creators of the oscillator. Work on a working model was carried out in the late 50s. However, this is only one of the versions, according to another,% K is named after the second name of the creator of the indicator – Kelly, and% D generally comes from the word deviation.
How Stochastic oscillator can be adjusted, and how is it useful for traders
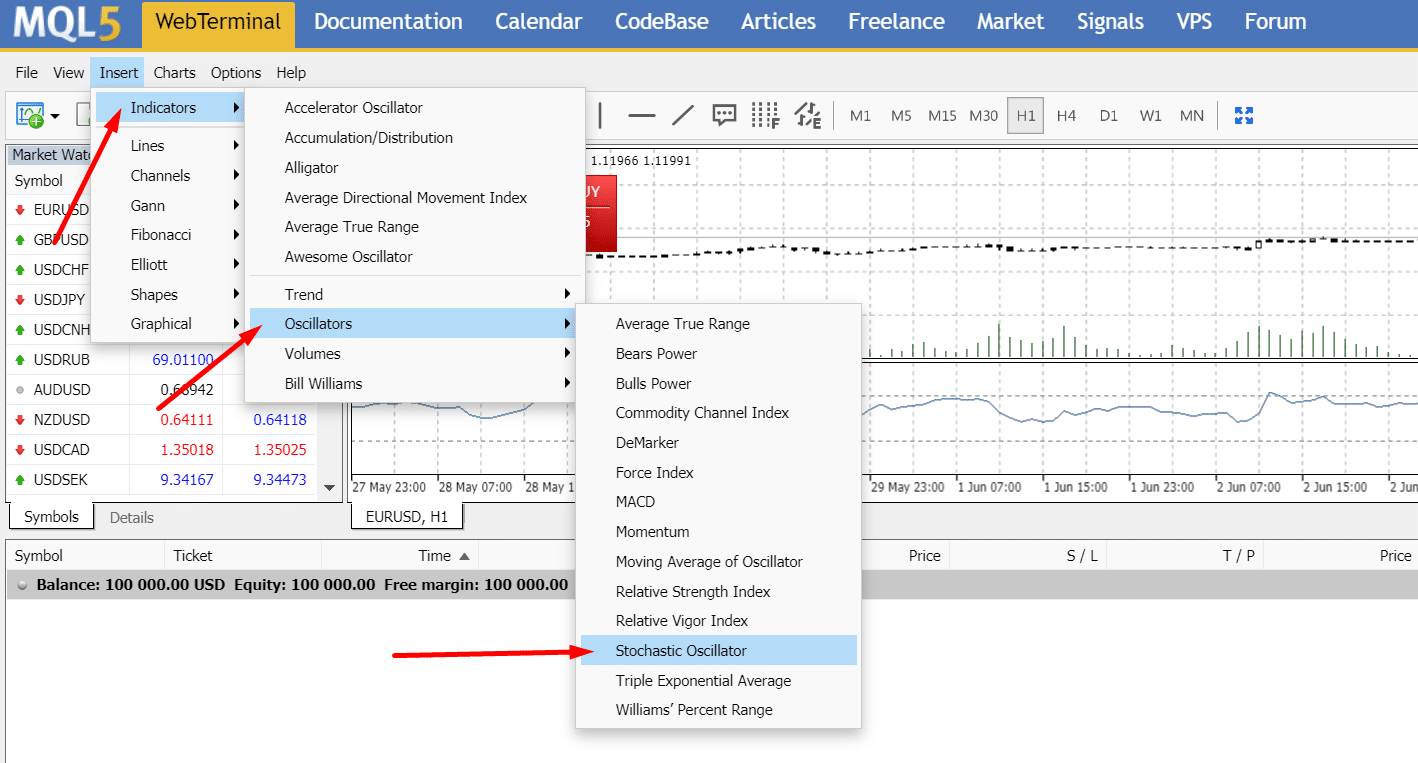
Using an oscillator is quite simple. It is worth noting that most brokers offer this tool in their online platform. You can also use MetaTrader to activate stochastic.
Here’s what you need to do:
- Open MetaTrader;
- Select Insert button;
- Choose Indicators, then oscillators.

After you select the Stochastic oscillator you can configure it for trading. In the “Settings” tab, the main settings are the periods of the fast and slow lines of the oscillator, the prices at which it will be calculated, as well as the method of constructing a moving average along the% K line (which, as we recall, is nothing more than% D).
Basic strategies, using Stochastic oscillator
The modern version of the stochastic oscillator, which is included in the standard version of the MetaTrader4 terminal, has a slightly modified calculation method, but the appearance of such a stochastic changes slightly compared to the classical one. The modern version of stochastic also allows the user to independently set the period n, as well as the periods and type of smoothing. The most popular parameters for calculating stochastic are (5, 3, 3). However, a number of authors recommend other parameters, for example, (8, 3, 3), (14, 3, 3), or even (39, 1, 1) [2].
What does the stochastic oscillator show? In fact, it allows you to set in percentage terms the place of the last closing price in the general price range for a certain selected period of time. If the obtained value is above 80 (overbought area), then the closing price is near the upper border of the range, if below 20 (oversold area), then, respectively, near the bottom.
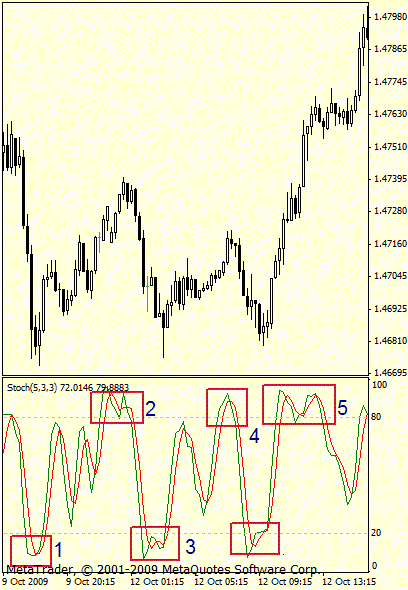
Based on this, the simplest way to trade using a stochastic oscillator becomes apparent. It is necessary to wait for the fast and slow stochastics to enter the overbought or oversold area, and then to leave it with the simultaneous intersection of the slow stochastics fast (Fig. 1). The output is by the opposite signal.

It is important to take into account that two consecutively intersecting intersections of the% K and% D lines indicate that the first signal was premature and that the previous, and stronger, price movement could resume [3].
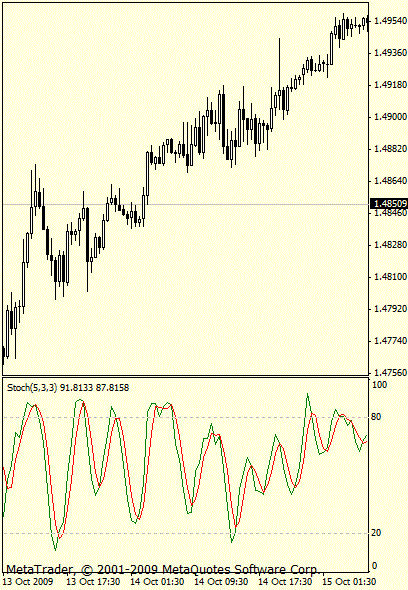
There is no need to recall that this strategy (like all strategies that use only oscillatory analysis) will more or less be acceptable to work only on the sideways market movement. So, in fig. 1, we see a good development of these signals in zones 1, 2, 3 and 4, while the market can be considered as being in the corridor. However, as soon as the trend movement begins, the strategy ceases to work and in zone 5 we incur a loss. In fig. 2 you can see that most of these stochastic signals in the trending market are false.

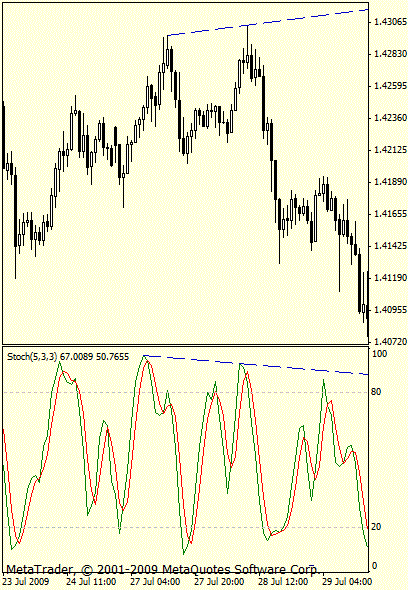
Another popular stochastic signal is the search for bullish divergence and bearish convergence. It is assumed that if the price chart makes a new high, and the stochastic at the same time forms a peak that is lower than the previous one, then this indicates a price drop soon.

Similarly, if the price chart forms a new local minimum below the previous one, but the stochastic does not, then this signals a possible rapid increase. The most important point is a correct reading of the chart and a timely response to changing market conditions. In this case, successful trading can be achieved.
The Conclusion
This article described key trading situations and options for reading the market. Using all these tips you can improve your Strategy and create a set of basic settings for working with this oscillator. It is worth noting that this is one of the most popular elements in the trading arsenal of any trader. You can use MetaTrader or various brokerage platforms in order to access the settings of all parameters.
Combinations with support and resistance lines as well as various indicators will help strengthen the accuracy of the strategy and increase the number of points for entering the market.
Traders should pay attention to the combination of this tool and other technical tools to increase the profitability of trading; all additional elements help to correct the inaccuracies of the oscillator and produce a more plausible result depending on market dynamics.