Investing.com is one of the most useful tools in forex trading. It is a free service that offers tools that can help you make better decisions in the market. As an experienced trader, I use Investing.com on a daily basis. In this article, we will look at some of the top free tools available on the website and mobile apps.
Economic calendar
Fundamental analysis is the approach of analyzing currency pairs and other financial assets by looking at news and macro information. An economic calendar is a tool that provides a schedule of when data will come out. It also shows historical data from around the world.
As a forex trader, there are many economic numbers in the economic calendar that will help you make better decisions. Some of the most important data are jobs numbers, manufacturing and services PMIs, Gross Domestic Product (GDP), industrial and manufacturing production, interest rates, retail sales, and inflation.
Investing.com offers a free economic calendar that you can use to find historical data from around the world. It also shows you the economic numbers that will come out in the future.
The screenshot below shows a calendar for Sunday, November 7th, 2021. On this day, the most important numbers that came out were China’s trends in exports, imports, and the trade surplus. The chart shows that in October 2021, the country’s exports increased by 27.1%, while imports rose to 20.6%.
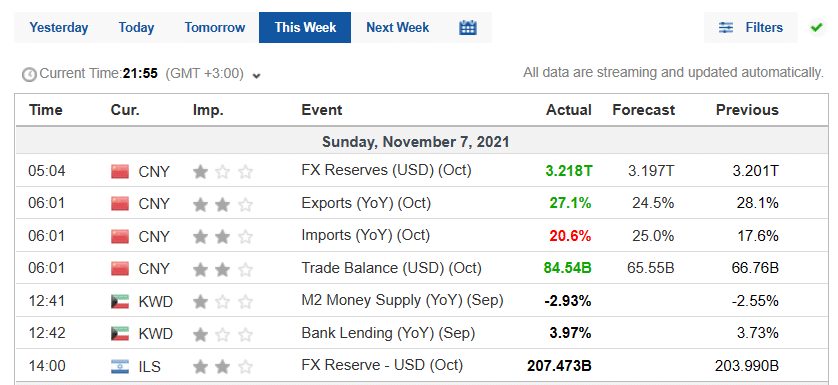
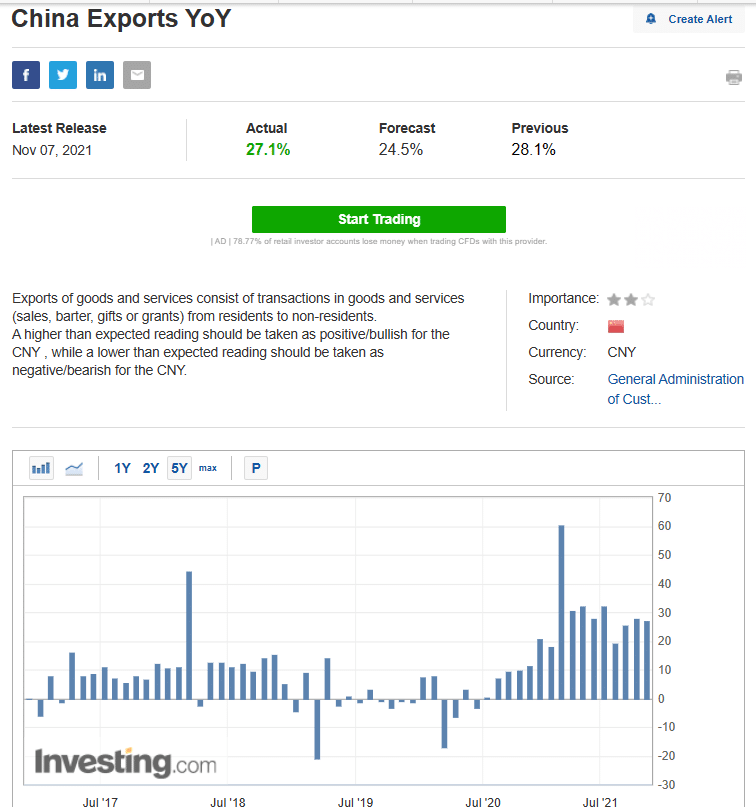
The economic calendar offered by Investing.com also provides you with context about the data. For example, if you click on the exports data, it will take you to a separate page that has more data. In the chart below, we see that Investing.com gives a description of the economic data, a link to the source, and an easy-to-use chart that shows you the trends over time. Therefore, you can easily use these trends instead of reading the entire report.
We recommend that you use the economic calendar in several ways. First, in addition to the desktop version of the website, you should download the mobile version of the application. This app is important because of the notifications it sends to its users.
Second, you can use the filter feature to remove the overall noise. For example, you can remove all countries that you don’t follow. For example, if you focus on developed country currencies, you can remove third-world currencies. You can also exclude data that causes no volatility.
Finally, you should look at the economic calendar every morning before you start trading. Also, you can look at and internalize the calendar during the weekend and at night.
Technical analysis summary
Technical analysis is the method of using indicators like Moving Averages and the Ichimoku Kinko Hyo to predict the direction of a currency pair. These indicators play an important part in the day and swing trading.
The best method of using indicators is to add them to charts. However, Investing.com has a free tool that provides a summary of key technical indicators. Therefore, even before you add them to a chart, you will be sure of what to expect.
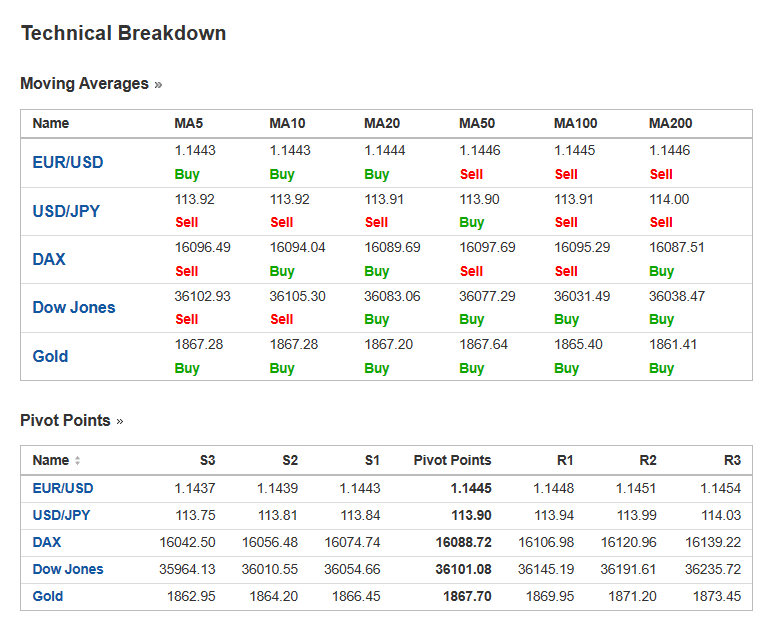
In addition to these indicators, the website provides pivot points for currency pairs. A Pivot Point is the overall average of the open, high, low, and closing price of a pair. You can then apply different calculations to find a series of support and resistance levels. There are several types of Pivot Points, including woodie, camarilla, and traditional.
In the chart below, we see a summary of Moving Averages and Pivot Points.
Meanwhile, in the chart below, we see that Investing has a summary of key indicators. In this case, the EURUSD is shown as a strong sell since 8 of the indicators are bearish.
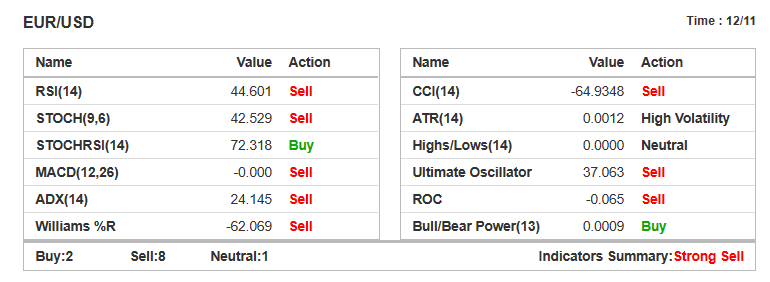
While these summaries are good, we recommend that you use them as reference points. Instead, you should combine this technical analysis with your own chart analysis.
Forex correlation
Currency correlation is an important concept in the market. For starters, correlation looks at the relationship between two currency pairs. There are three main ways of looking at correlation.
First, two currency pairs can be closely correlated. In this case, the two currency pairs will typically move in the same direction. For example, in most cases, the USD/JPY and USD/CHF tend to move in the same direction.
Second, two currency pairs can have an inverse correlation. In this case, these pairs tend to move in opposite directions. And finally, some pairs could be uncorrelated, meaning that they don’t have any relationship.
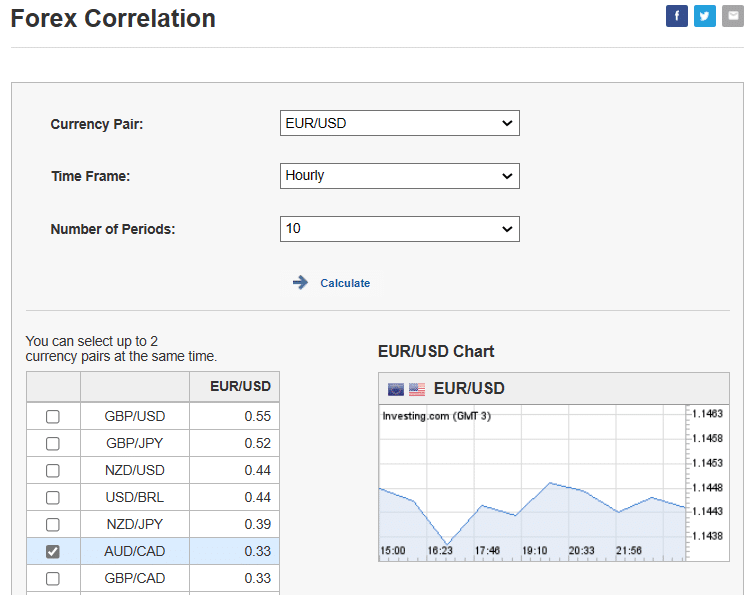
Correlation is calculated using a relatively complicated mathematical formula. Another easier way of calculating the correlation is to use Google Sheets or Microsoft Excel. However, Investing.com has a tool that calculates correlation automatically. For example, in the chart below, we see a correlation between the EURUSD and several currencies. We see that it has some positive correlation with the GBPUSD pair.
Profit calculator
In forex trading, even the most experienced traders often struggle to know how to calculate profits. This is mostly because of the complexity involved in calculating lot sizes and the margin. Therefore, having a tool that calculates profits before you enter a trade can be very helpful. Investing.com has a tool that can help you calculate your profit expectations.
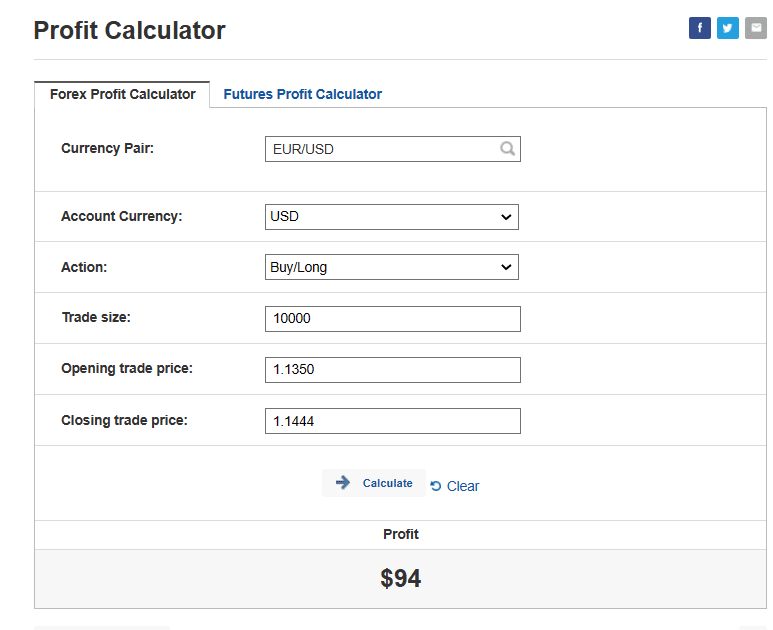
In the chart above, we see how the tool calculates profit levels.
Other tools
Investing.com has other tools that will help improve your forex trading. For example, it has a price list, where you can see the prices of most currency pairs at once. It also has a news tab, where you can find the most recent forex analysis. It also has charts and a margin calculator that you can use to do margin calculations.