Indicators are at the heart of many kinds of technical analysis that takes place in the forex market. The trading tools allow traders to decide on trades to take, when to enter and when to exit. Being one of the best charting platforms, TradingView comes with an arsenal of tools that allow technical analysts to discover investment ideas.
A top trading indicator on TradingView is sure to help anyone stay in control of happenings in the market, from anywhere and on any device. The platform stands out partly because it makes it easy to choose how trading signals should be sent while leveraging the various indicators.
Below are some of the best TradingView forex indicators.
Squeeze momentum indicator
Developed by John Carter, the Squeeze Momentum is an ideal tool for identifying volatility in the forex market. It shows when volatility increases and decreases, allowing traders to know when the price moves from a trend into flat movement and vice versa.
Visualization
Grey and Black dots: Whenever black dots appear in the middle line, they signal periods of squeeze or low volatility. In this case, the market is preparing itself for an explosive move. Similarly, they signal high volatility whenever gray crosses appear, implying the price is likely to move rapidly.
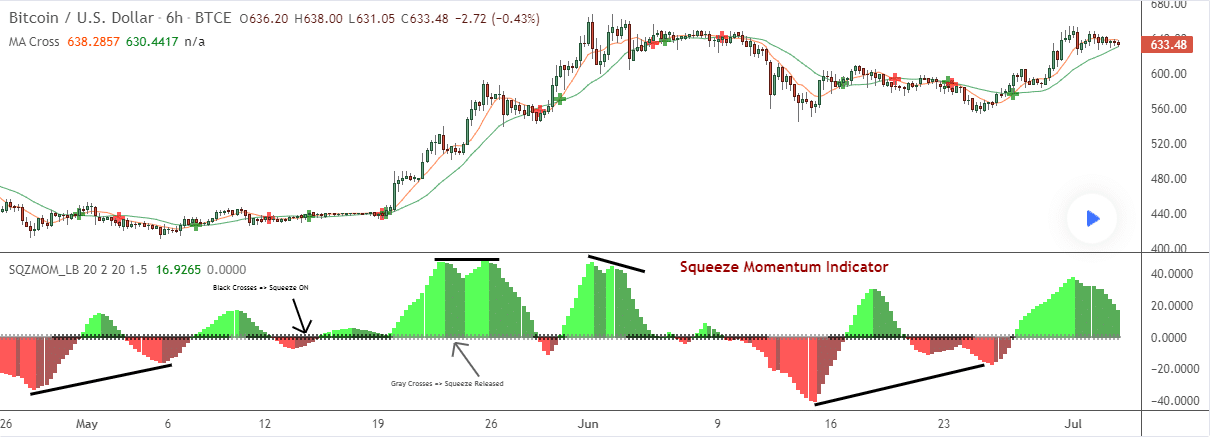
Red and Green histograms: The histograms show price movement. Bright green color changing into dark green color shows that price is decreasing. Bright red color changing to dark red color shows the increasing price.
How to enter trades
According to Carter, one should plan to enter positions as soon as grey dots appear as they show volatility increases. Consequently, if the histogram is above the middle line, one should eye long positions. If it is below the zero line, short positions would be appropriate. One should stay in the trade until the histogram becomes bigger or smaller.
The Bitcoin chart above shows bitcoin price increasing as grey dots appeared and the green histogram became bigger, signaling buy opportunity.
MACD Custom Indicator-Multiple Time Frame
A MACD Custom is a customized version of the popular Moving Average Convergence Divergence indicator integrated into TradingView. It is ideal for trading reversals in the forex market. It consists of a histogram and a line that oscillates around the middle line to signal momentum shifts.
How to use
Traders can look to enter long or buy positions when the MACD bars are well below the zero line, which signals oversold conditions. The buy signal is confirmed by the fast Moving Average crossing the slow Moving Average from below and starting to move up.
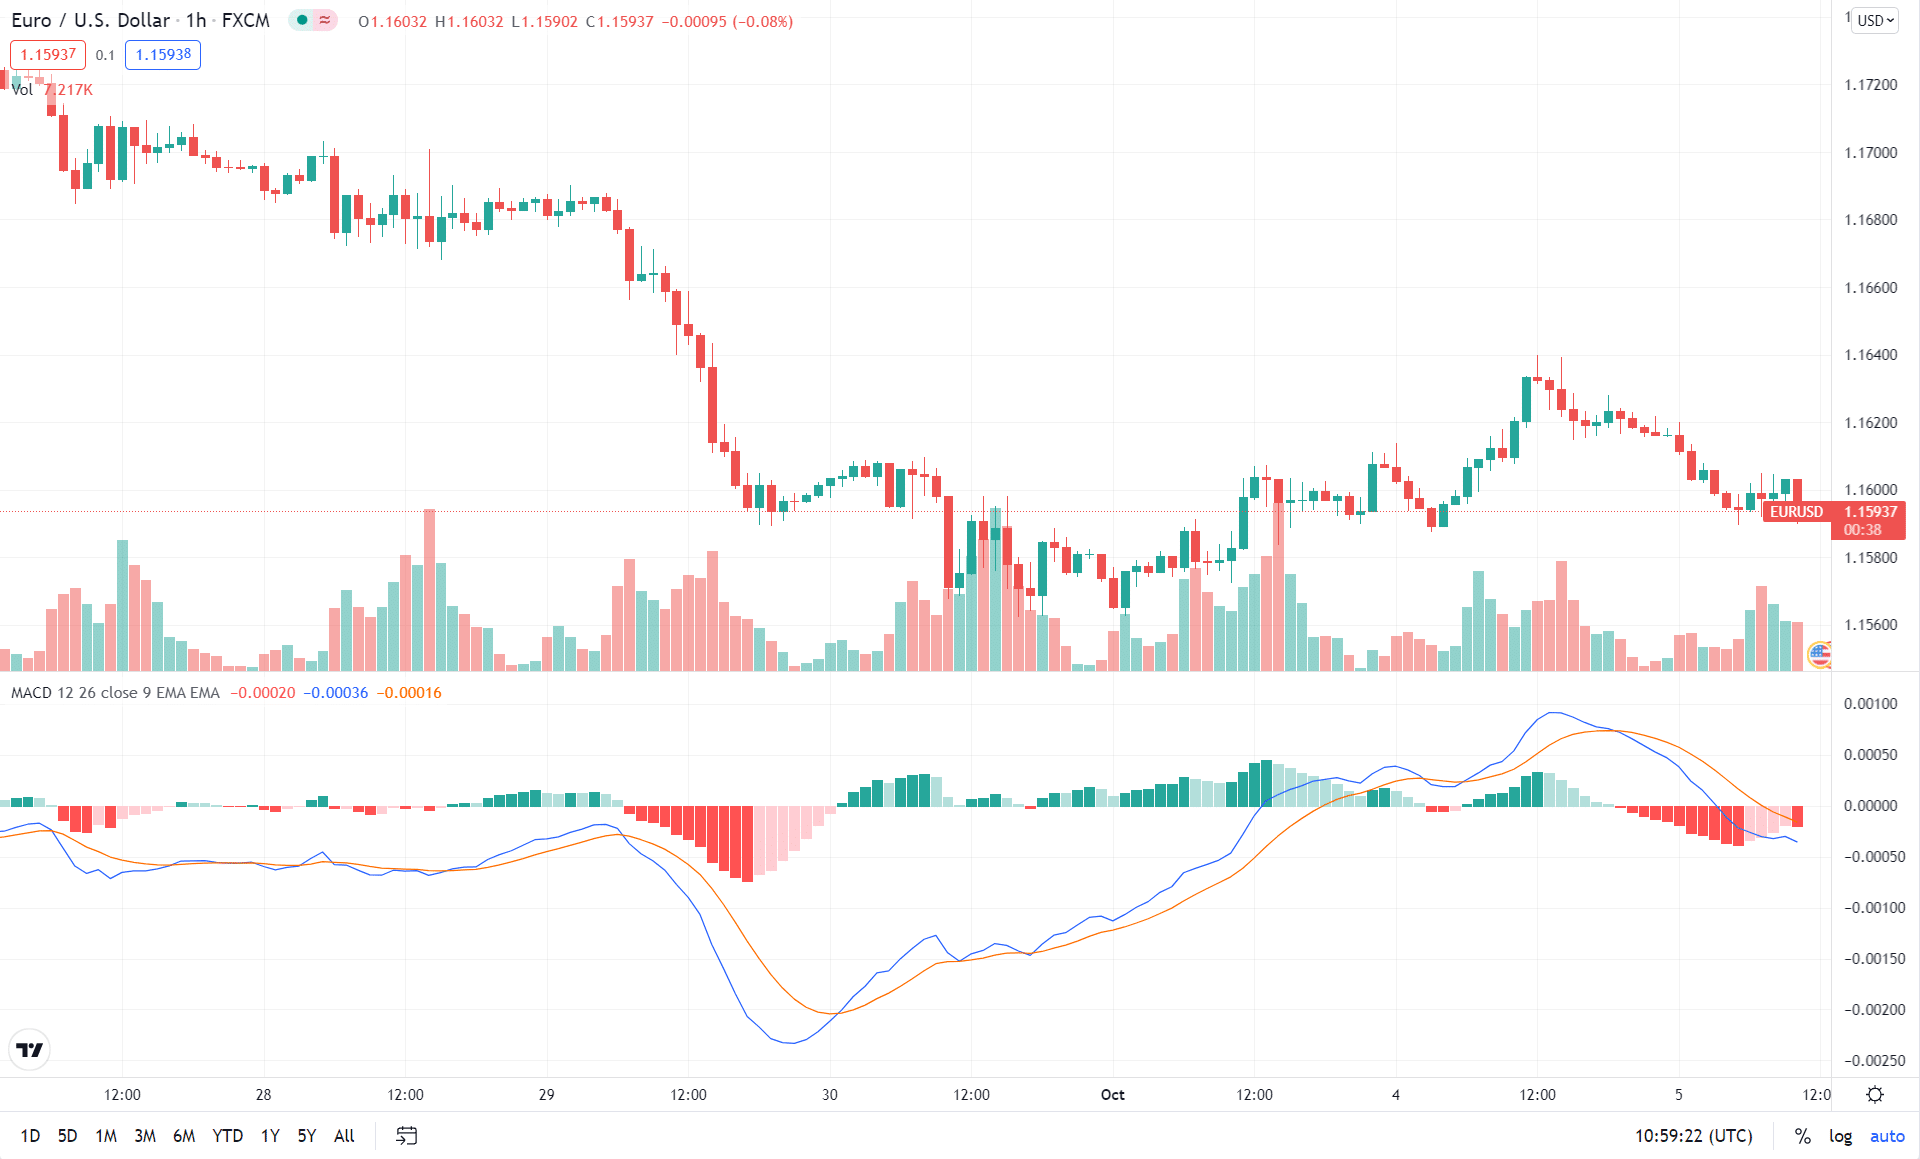
Short or sell positions can be triggered when the MACD bars in the histogram are well above the zero line as it signals overbought. The sell signal is confirmed by the fast Moving Average crossing the slow Moving Average from above and moving lower.
Bollinger Bands
It’s another TradingView trading tool that makes it easy to take advantage of changing volatility. It consists of a Simple Moving Average and two lines plotted at two standard deviations of the central moving average line.
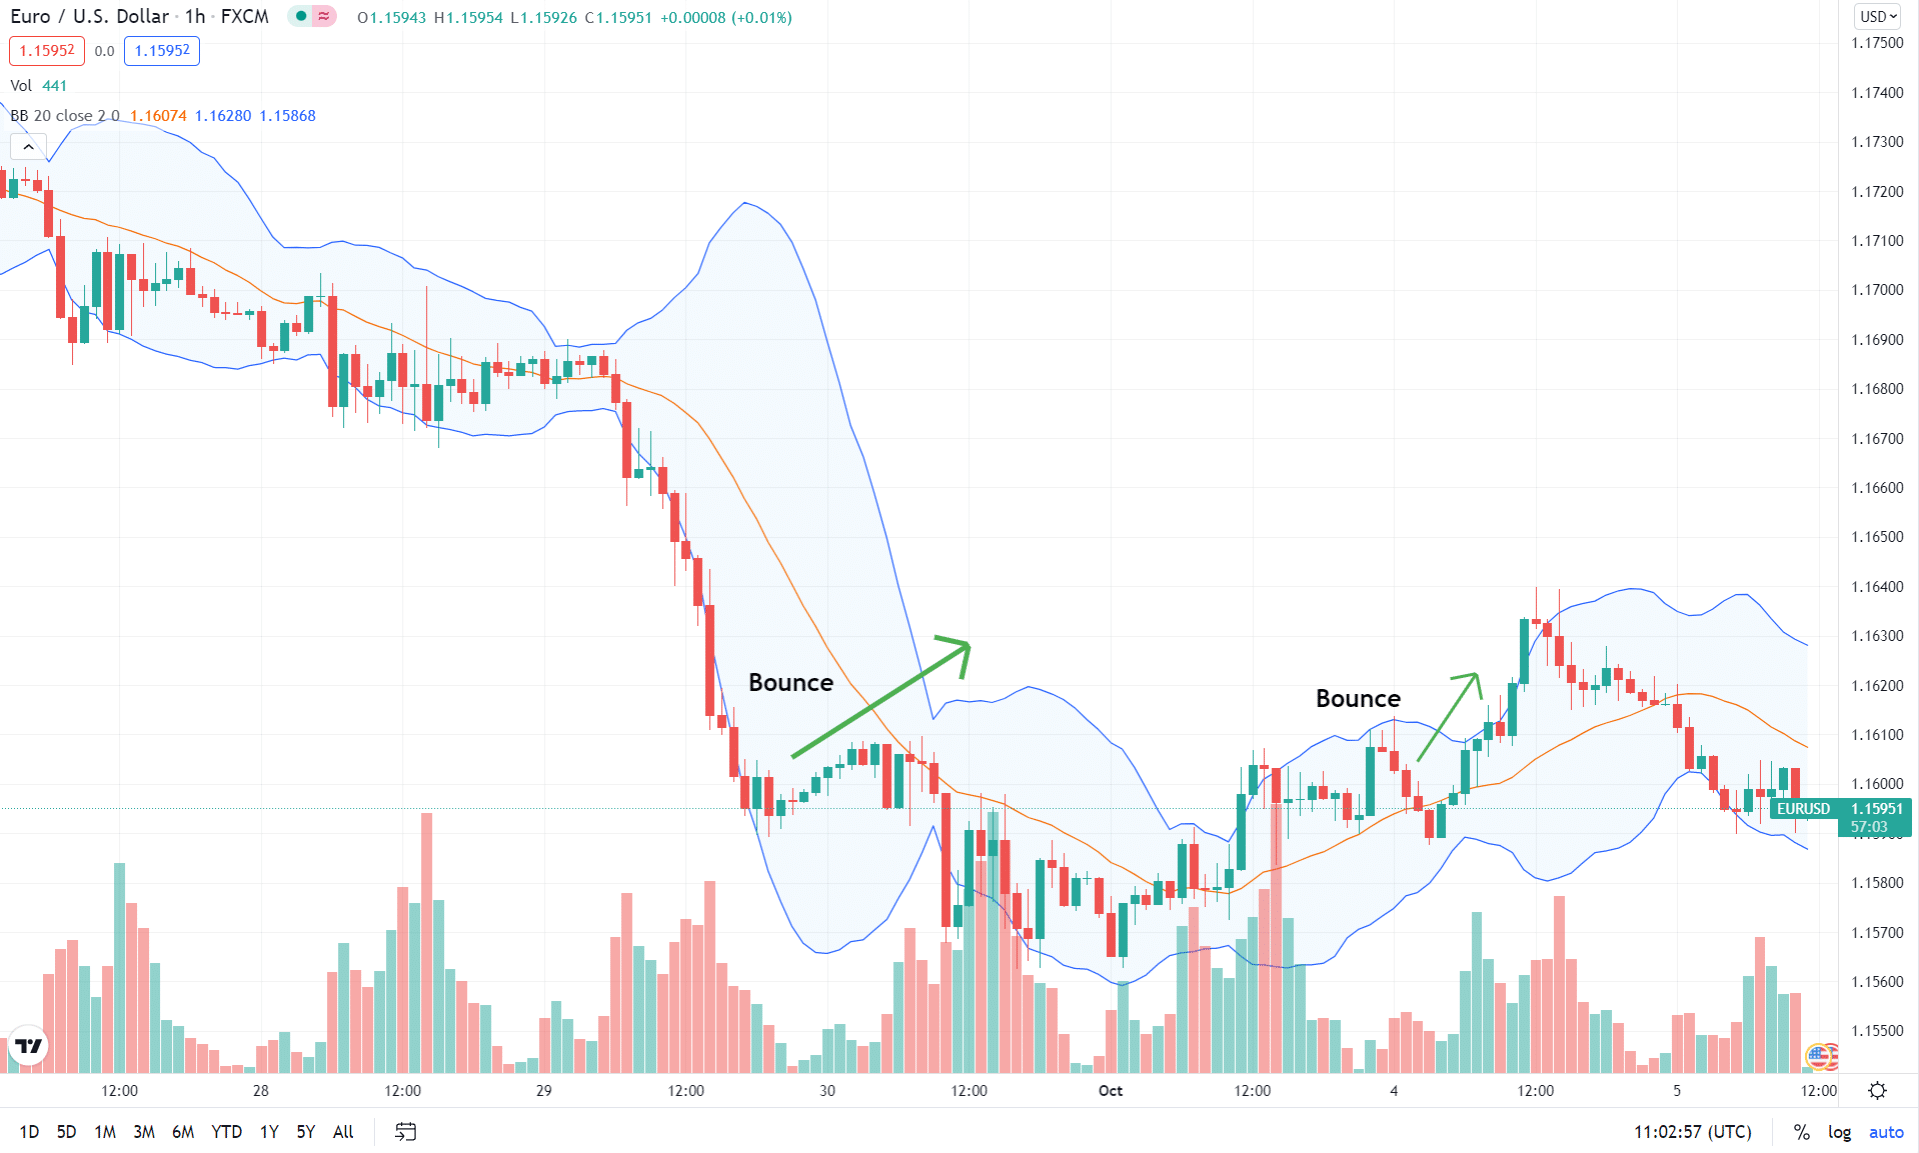
When the band narrows, it signals low volatility and that the market is quiet. In this case, one should be prepared for a potential price breakout. When the band is wide, market volatility is high. It is perfect for trading range-bound scenarios where a price tends to oscillate within the upper and lower bands.
In this case, one can look to enter short positions as soon as price touches the upper band and long positions as soon as price touches the lower band. The band, in this case, acts as support and resistance level. Should the price break above the upper band, then it is likely to continue moving up. The reverse is also true.
Relative Strength Index (RSI)
RSI is a momentum indicator used to identify overbought and oversold conditions. It is scaled from 0 to 100 with readings above 70 overbought signaling conditions, while readings below 30 imply oversold conditions.
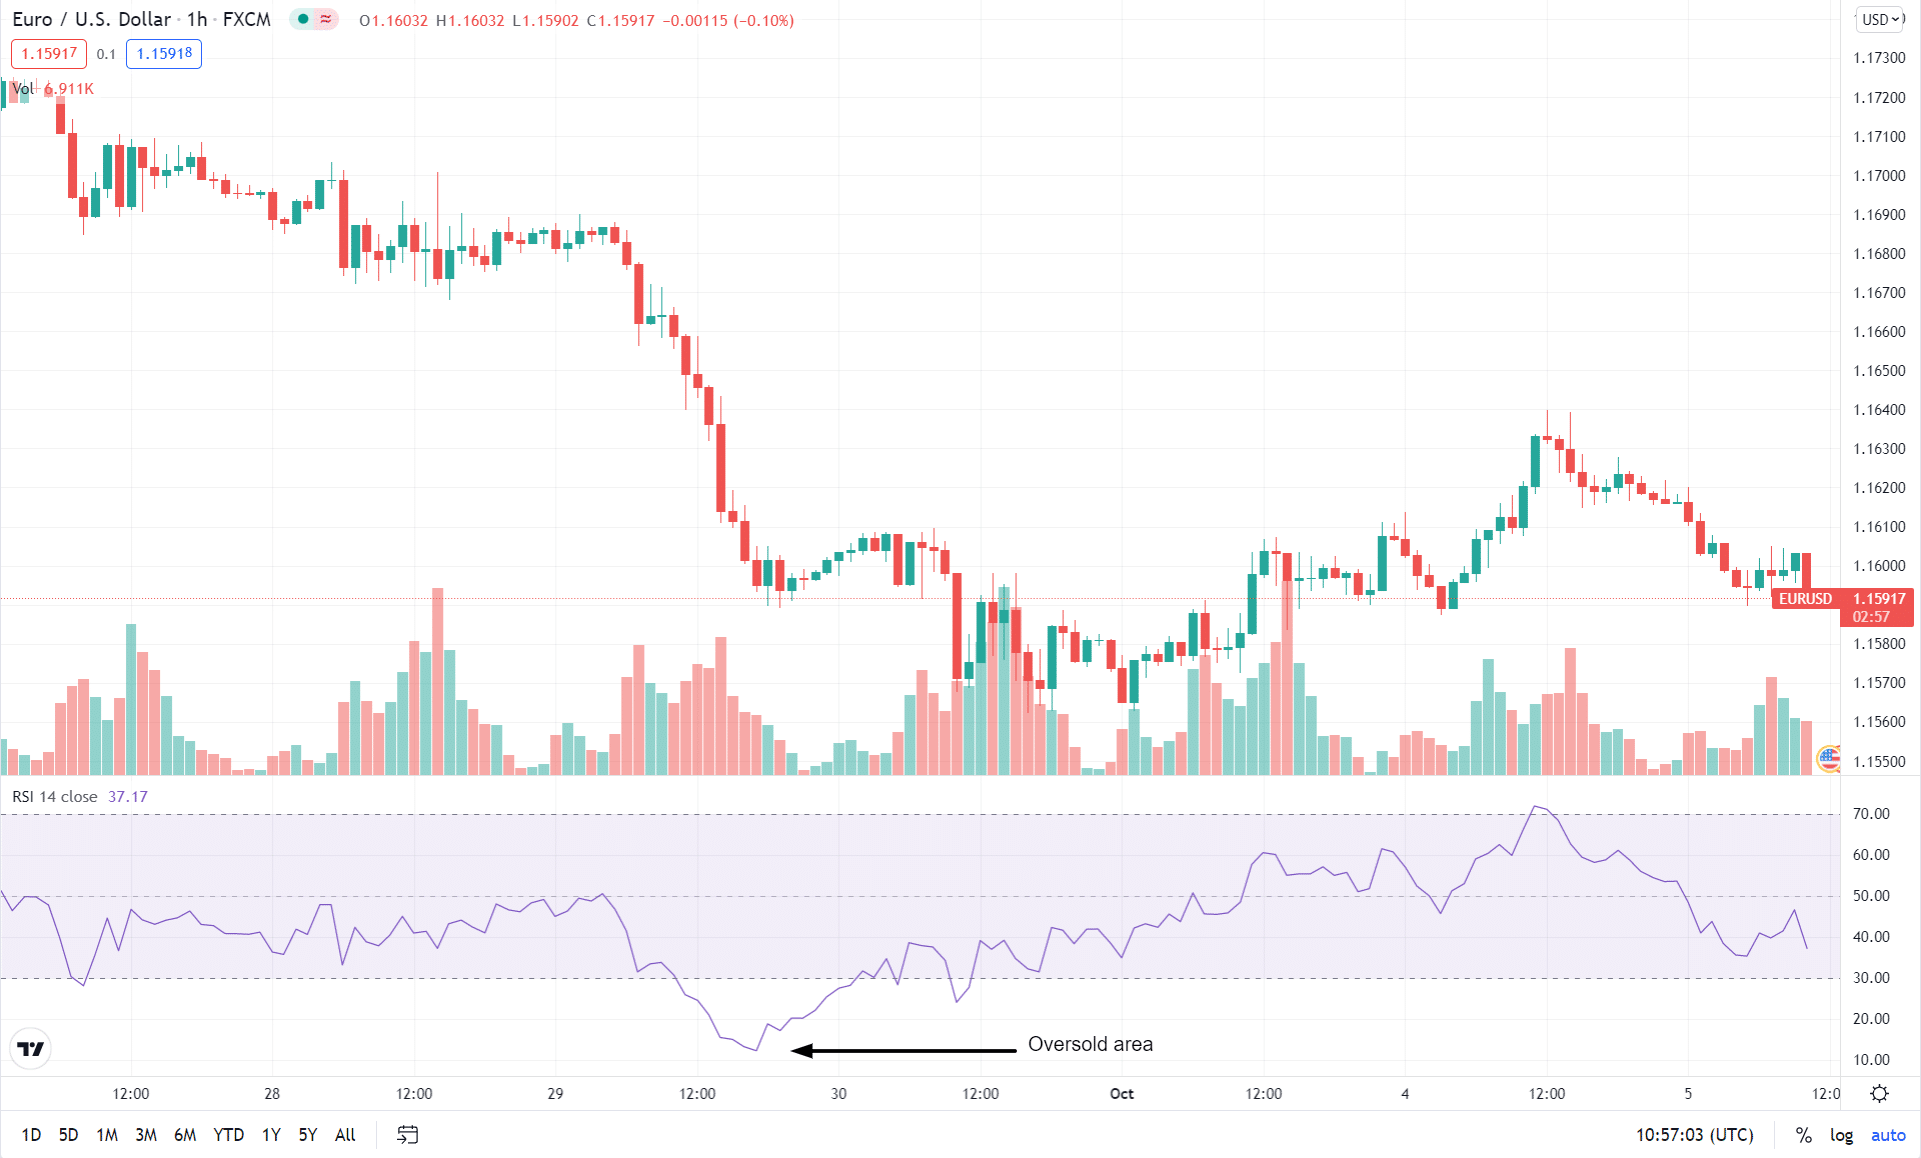
In most cases, technical analysts eye buy opportunities whenever the RSI reading is well below the 30 level, say 20 or even 10. Sell opportunities, on the other hand, are eyed as long as the RSI reading is way above the 70 marks, say into 80 or 90 levels. When the RSI reading is above 50, it implies the market is in an uptrend, while below 50 readings imply the price is in a downtrend.
Stochastic indicator
The stochastic works the same way as the RSI to warn of overbought and oversold conditions. Additionally, it is commonly used to find where a trend is likely to end. It is scaled from 0 to 100, with readings above 80 implying overbought while below 20 oversold.
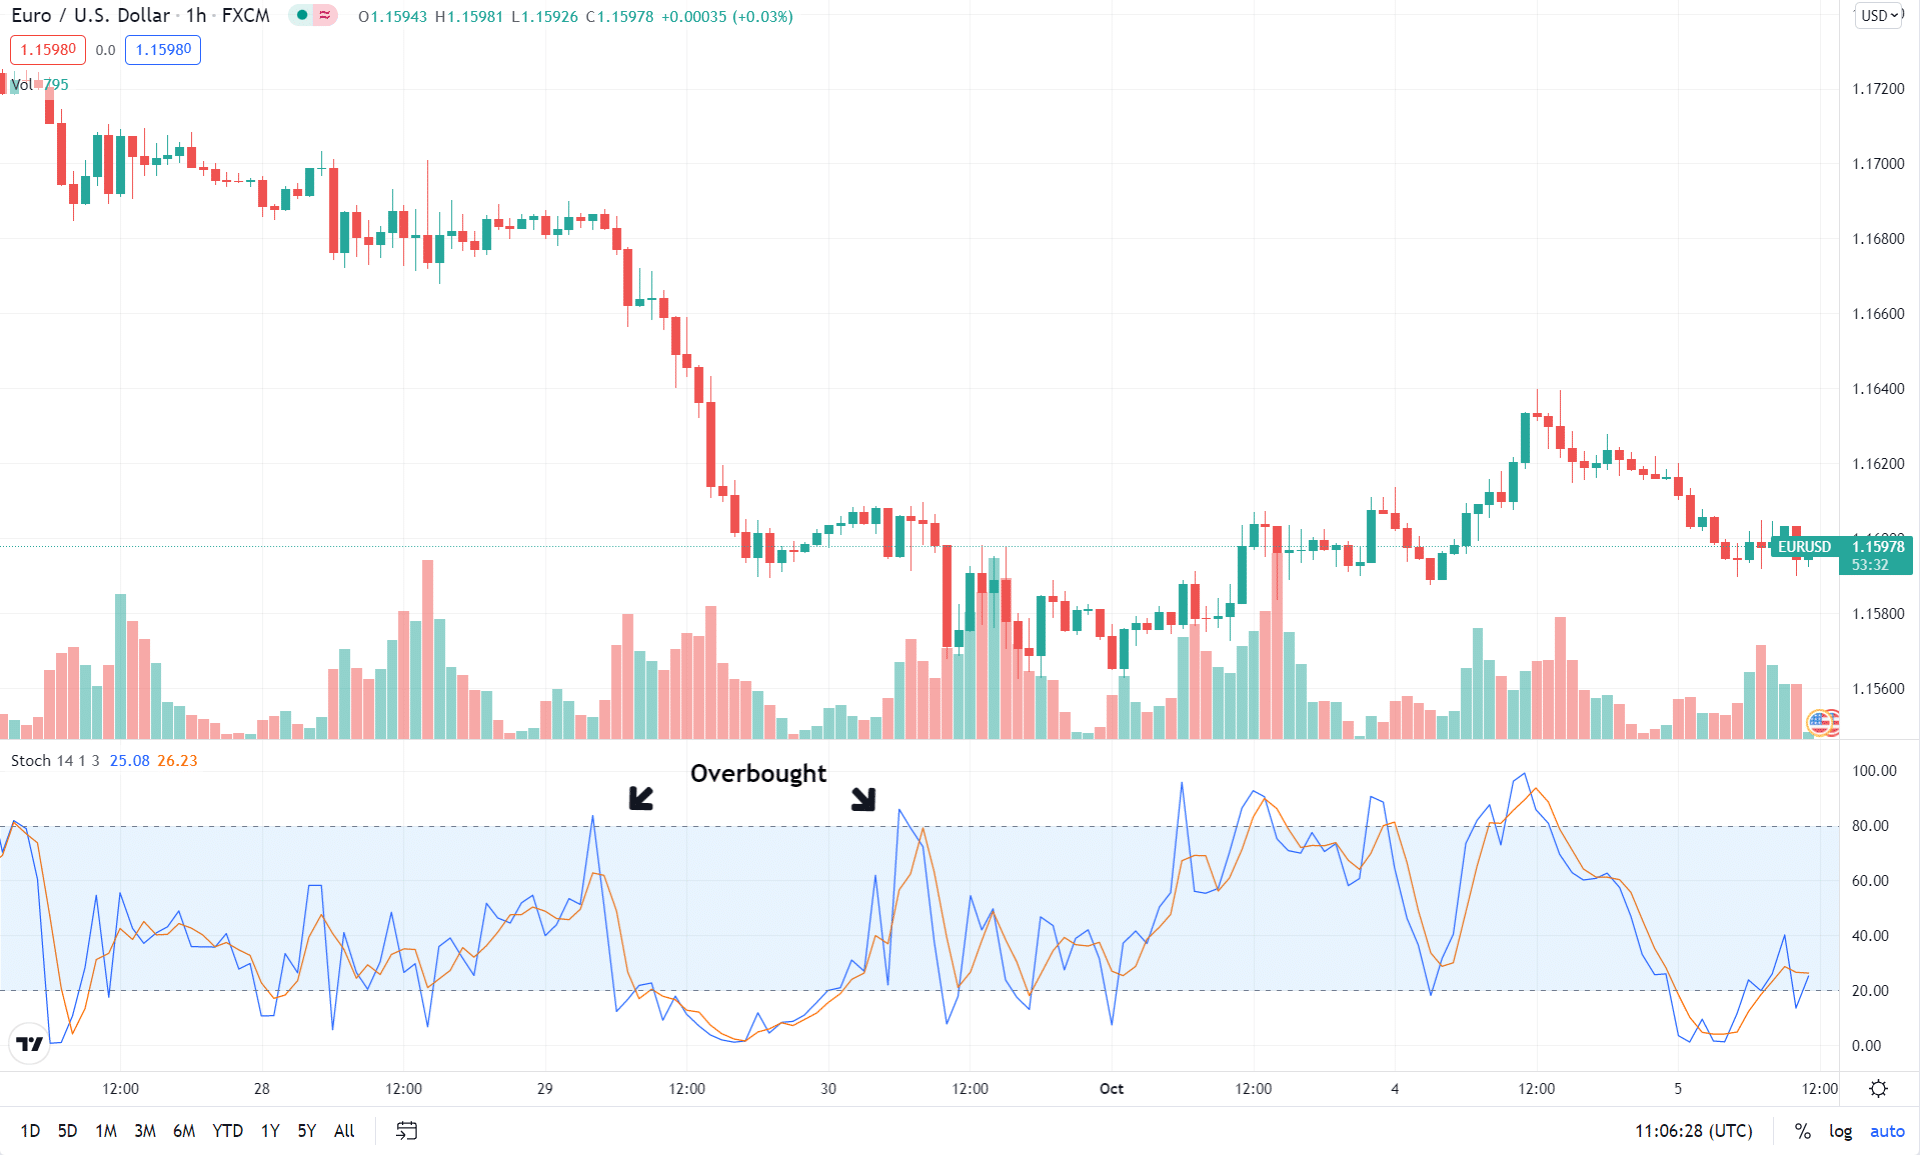
When the stochastic lines are below 20, it signals oversold conditions and that an uptrend is likely to follow. Similarly, when the stochastic lines are above 80, its signals are overbought, and that a downtrend is likely to follow, as is the case with the chart above.
Average Directional Index (ADX)
When it comes to trading, the idea is to identify the underlying trend and try to align trades with it if one is to increase the chances of making money. The Average Directional Index affirms trend strength in any direction.
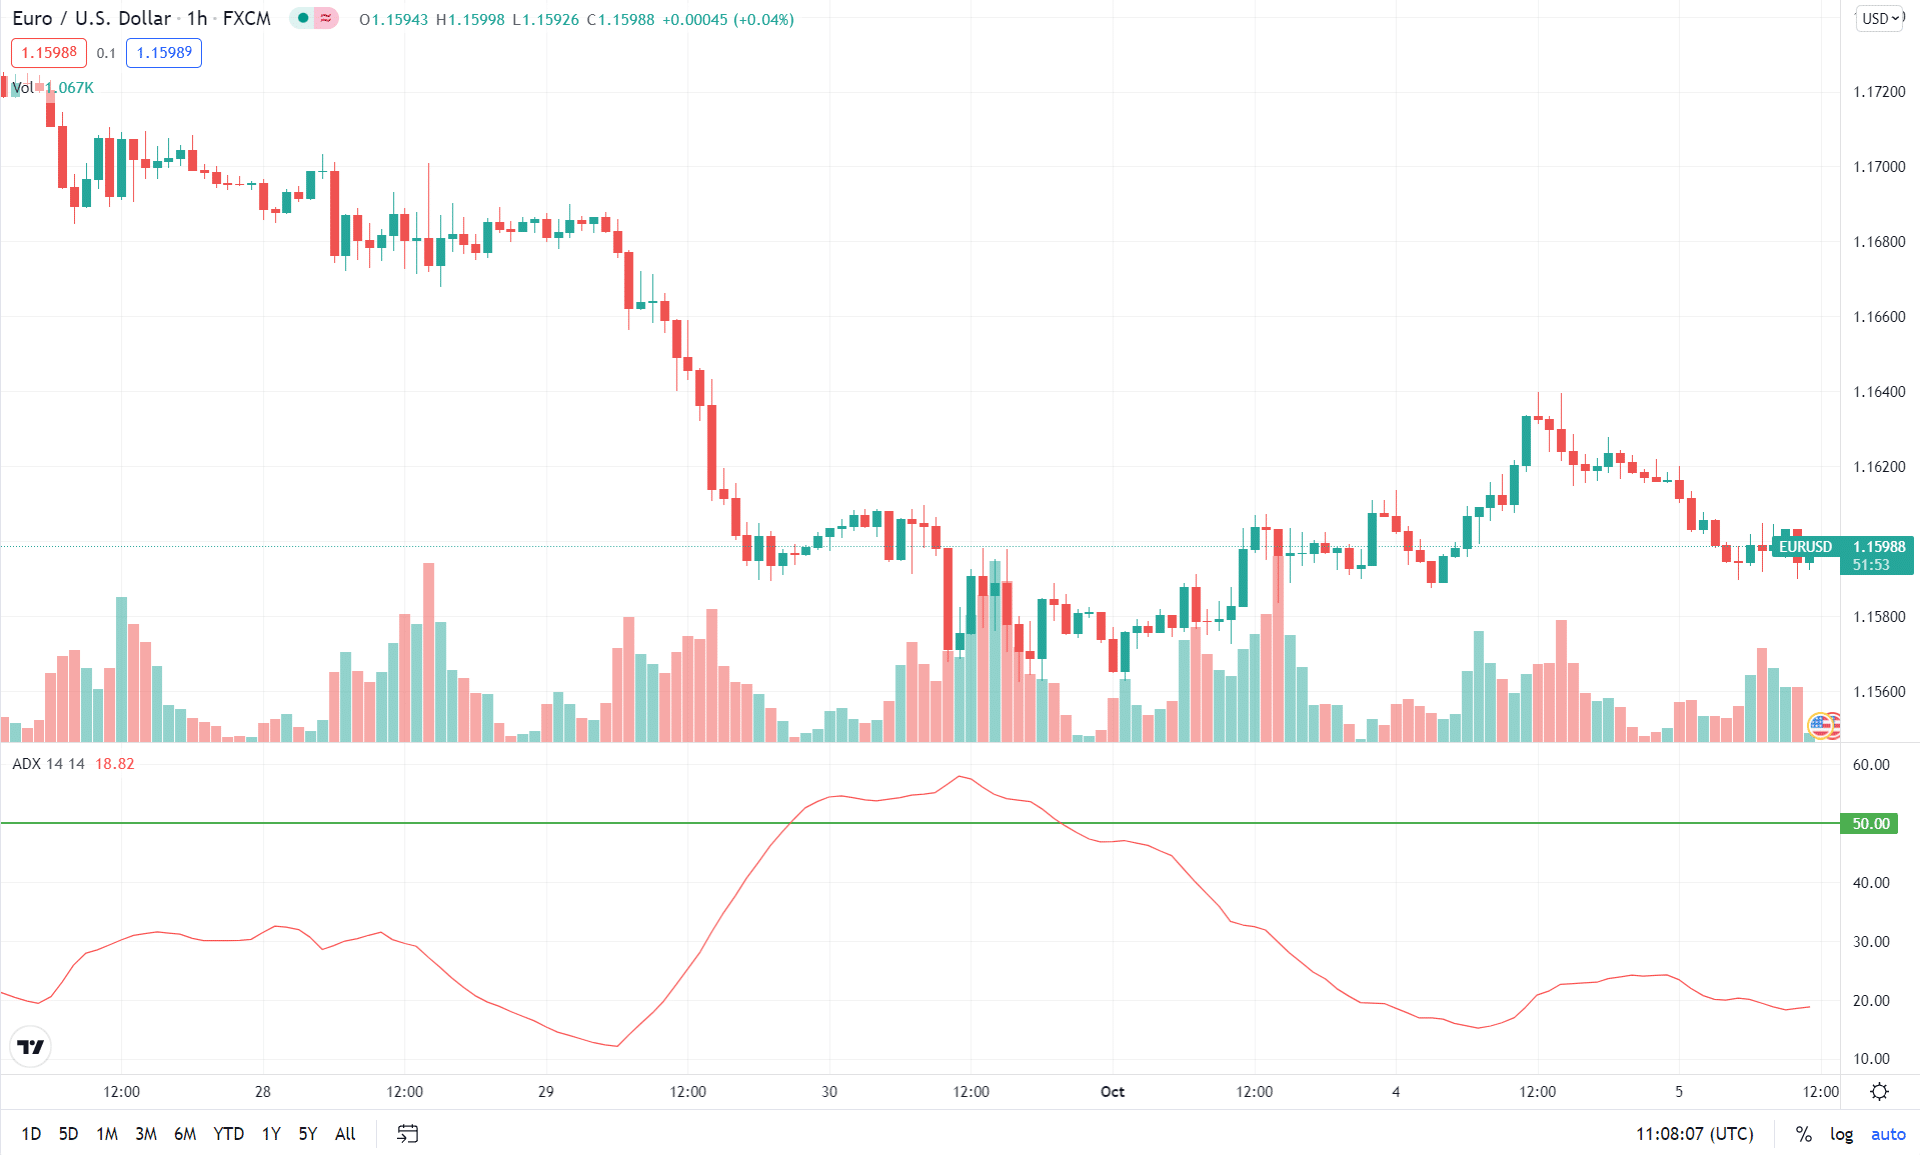
It is scaled from 0 to 100. Readings below 20 signal a weak trend, while readings above 50 signal a strong trend, be it up or down. It is commonly used to avoid fake trends as people only focus on strong trends.
ATR should never be used in isolation. It should be used with other indicators such as the Moving Average, which identifies whether the price is trending up or down. In return, the ADX will determine the strength of the trend.
Parabolic Stop and Reverse (SAR)
It is one of the simplest TradingView indicators for anyone looking to identify the direction of price movement. The Parabolic Stop and Reverse comes with dots placed below and above the price to indicate price direction.
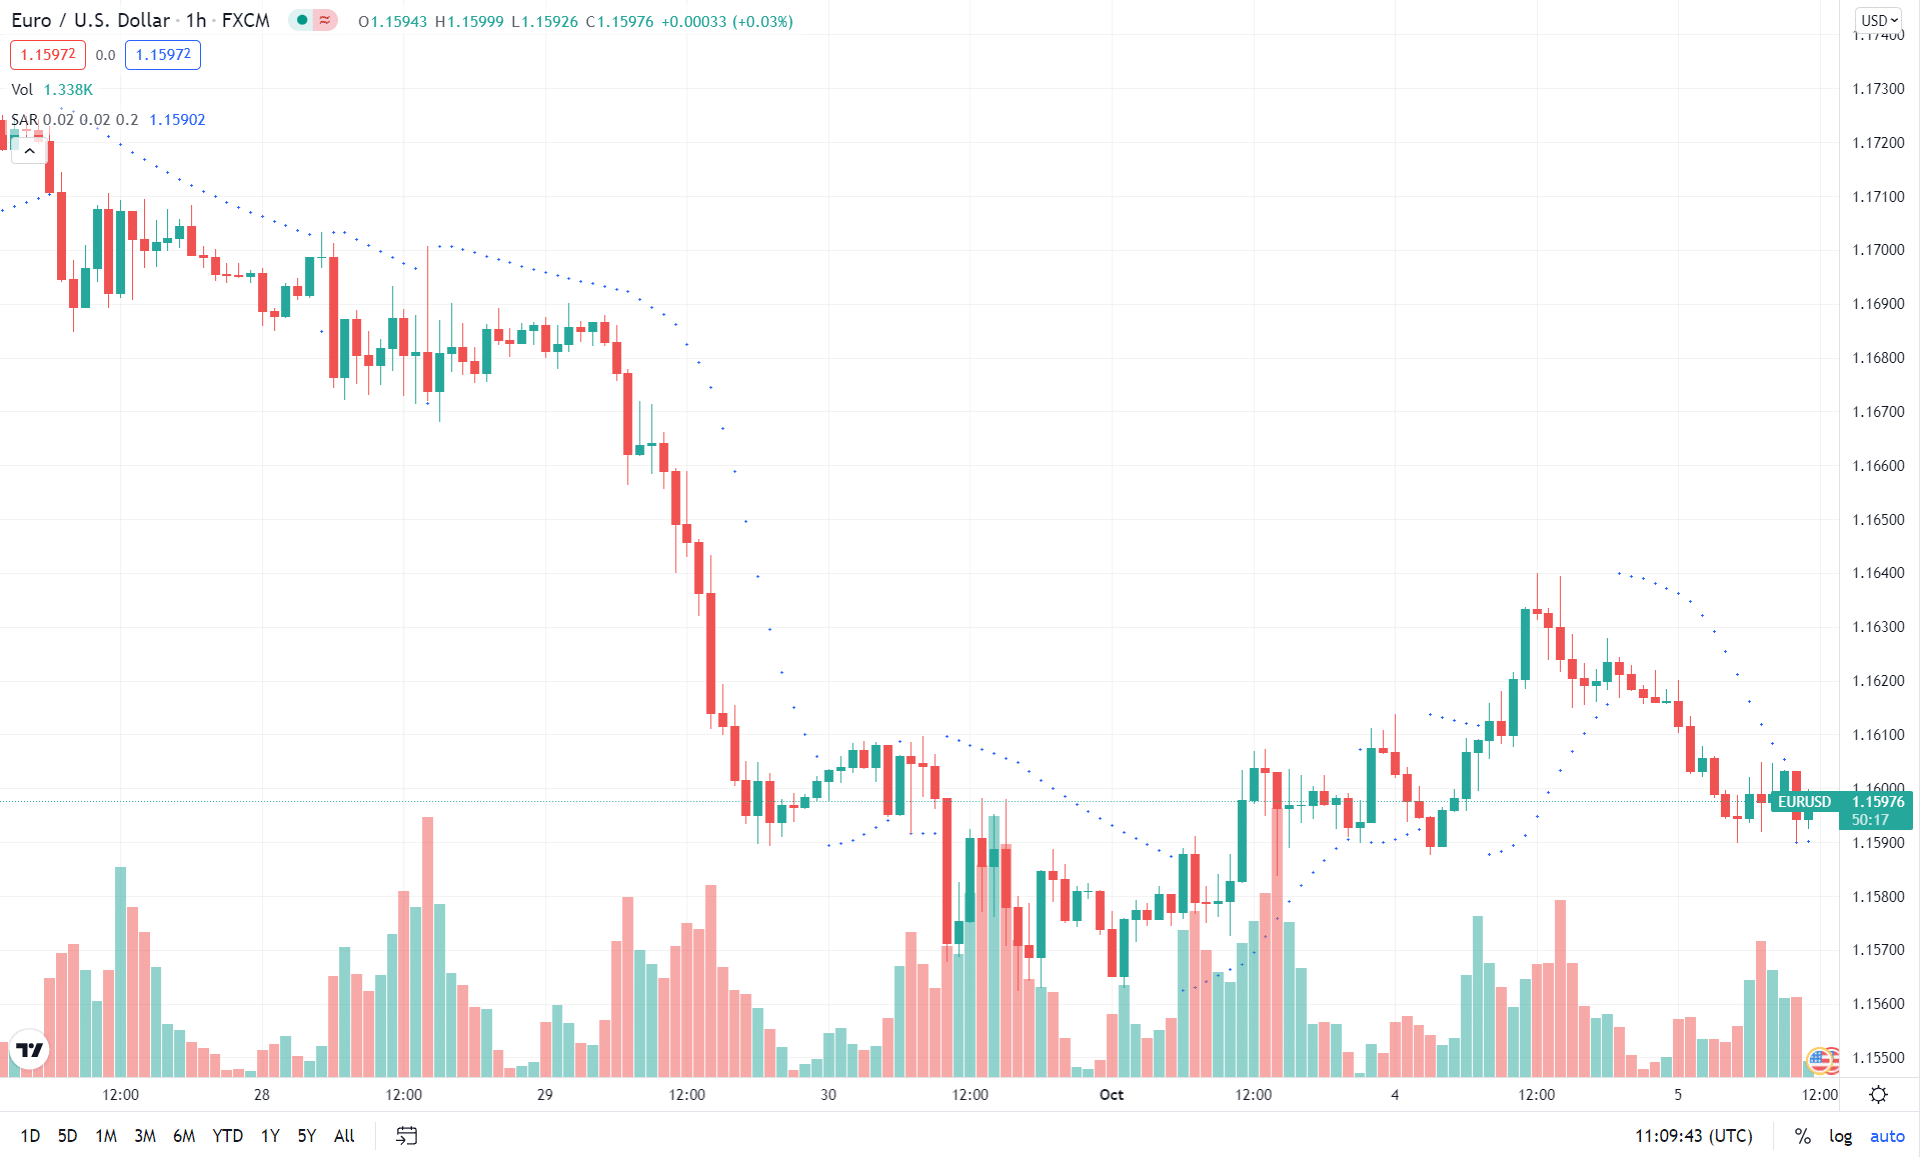
The market is considered to be in a downtrend whereby traders should eye short trades whenever the dots are above the price. When the dots are below the price, the market is considered to be in an uptrend signaling it might be time to eye long or buy positions.
It should never be used in range-bound markets as there will always be a lot of noise, and the dots will flip from side to side, consequently giving wrong signals.
Conclusion
In this article, we looked at some of the most popular technical indicators that are offered by the TradingView charting service. Some of the indicators are modified to look more appealing. Traders should keep in mind that most of these indicators work best when combined with other analysis tools, either other indicators or, even better, something unrelated to the price.