Cryptocurrencies, as with any financial market, are highly chaotic and dynamic. However, die-hard proponents of technical analysis believe we can make sense of the mayhem by exploiting repeatable patterns over time for consistent profits.
This study typically encompasses the observations of trends, along with, of course, breakouts and range. Any cryptocurrency chart will be going through either of these phases at any given time.
However, this article will look at the latter two (breakouts and range) and how they work in cryptocurrencies.
What is a breakout? What about range?
A breakout occurs when a coin’s price forcefully violates or ‘breaks out’ of defined support or resistance area. Before this event happens, the market will usually be contained around such places indefinitely.
Many define this period as a consolidation phase or range, although a breakout can also transpire in non-linear conditions. At some point in time, the buying or selling activity will increase substantially, ultimately causing such zones to be broken rather forcefully.
Before the breakout, traders will observe the levels with keen interest, typically by using pending sell/buy orders (or through market execution) depending on where they forecast the new direction is likely to be.
The traders who already have live trades would also watch for these areas as potential exit points should the breakout turn into a ‘false break’ or ‘fakeout.’
As previously mentioned, breakouts can happen in various forms, including chart patterns like flags, wedges, triangles, head-and-shoulders, and, of course, in range-bound conditions. Range occurs when a cryptocurrency trades ‘sideways’ or ‘flat’ between defined low and high prices instead of a specific direction.
Such market conditions usually happen when a security has been moving on a certain trajectory for a long time. Although range and breakouts are not the same things, they are intertwined because some form of range occurs before a breakout, the latter of which usually resumes the previous trend.
An example of a breakout and range in action
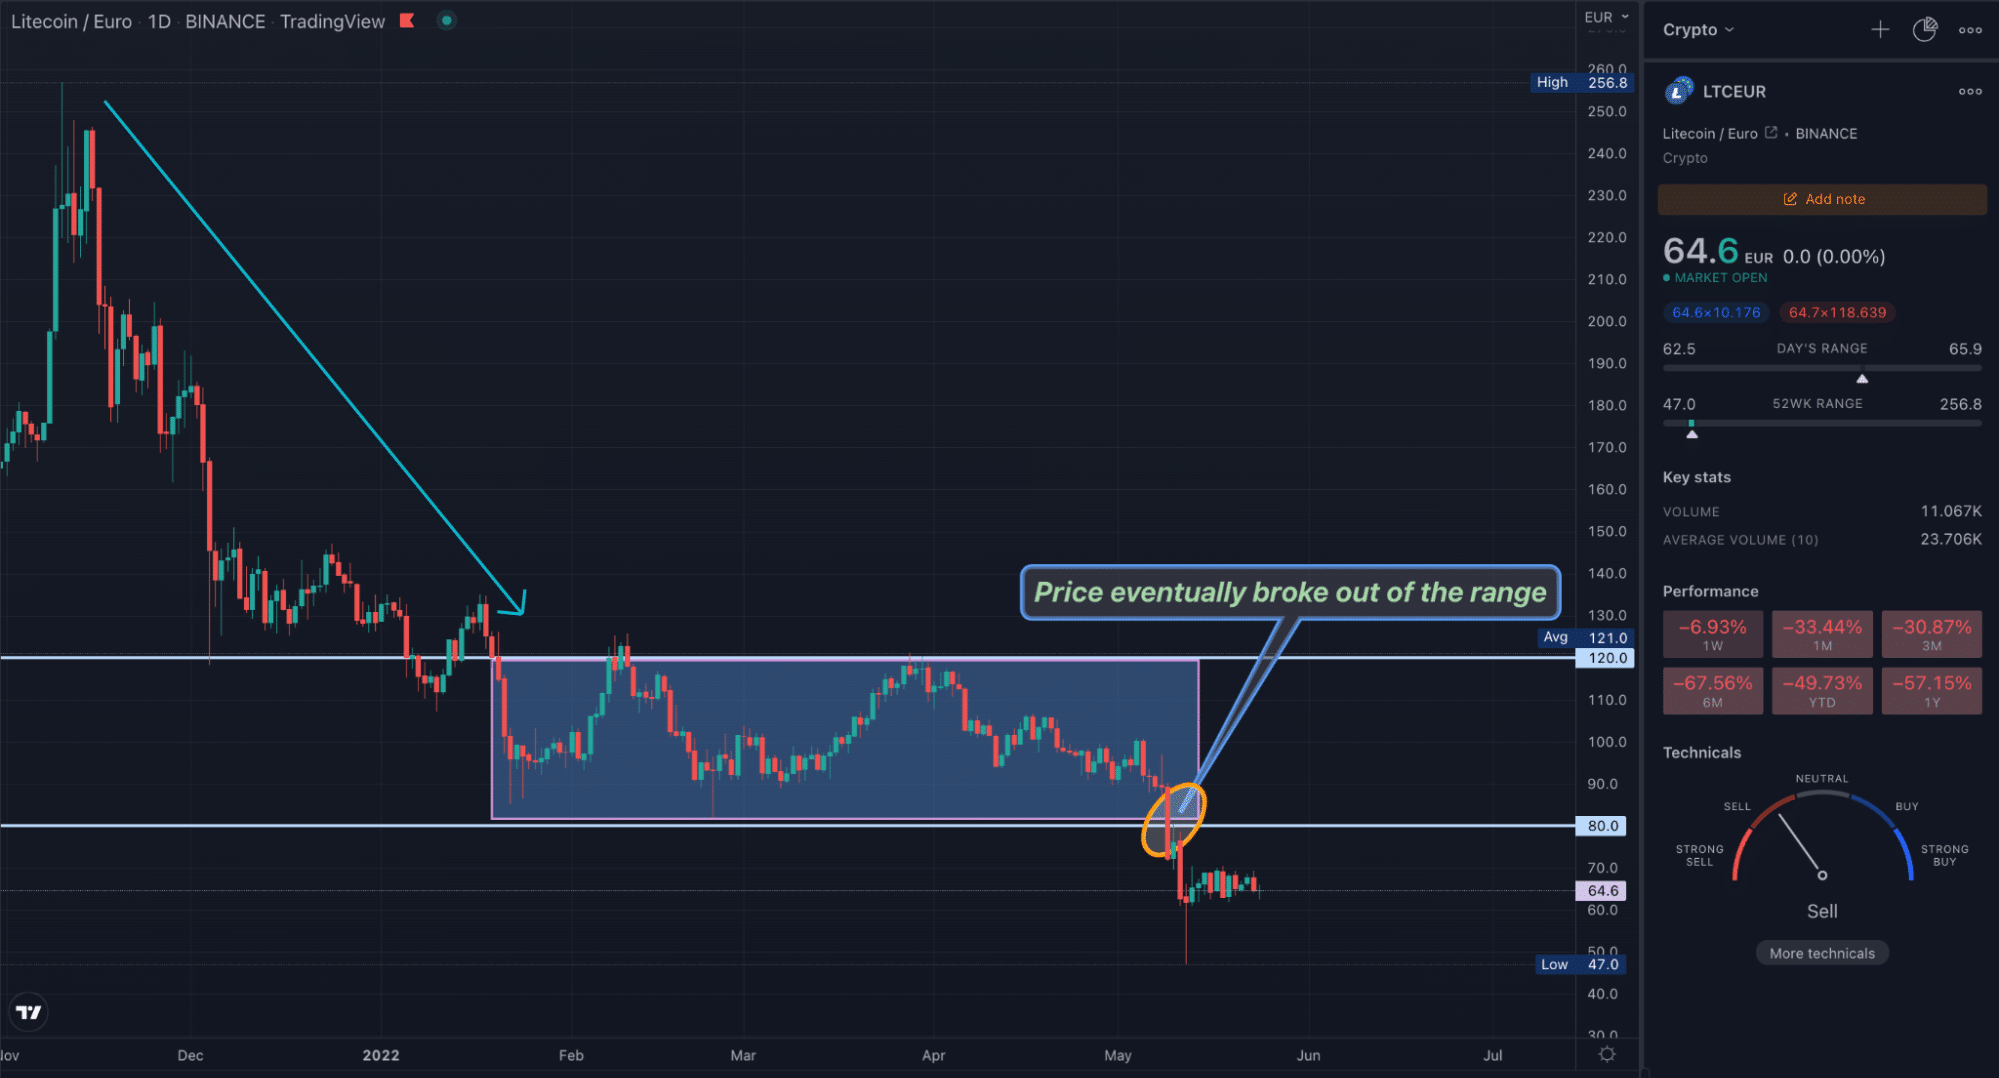
The chart below is of the LTCEUR market on the daily time frame. Here, we’ve exemplified the most basic breakout in ranging conditions using horizontal support and resistance. Previously, LTC was in a downtrend until a pause where the price went sideways between the €80 and €120 area (as highlighted in the rectangle).

Eventually, the market broke out of this zone, which resulted in lower prices and a continuation of the bearish movement.
Popular breakout and range trading strategies
Now, let’s explore the most well-known breakout and range trading strategies in cryptocurrencies.
Using chart patterns
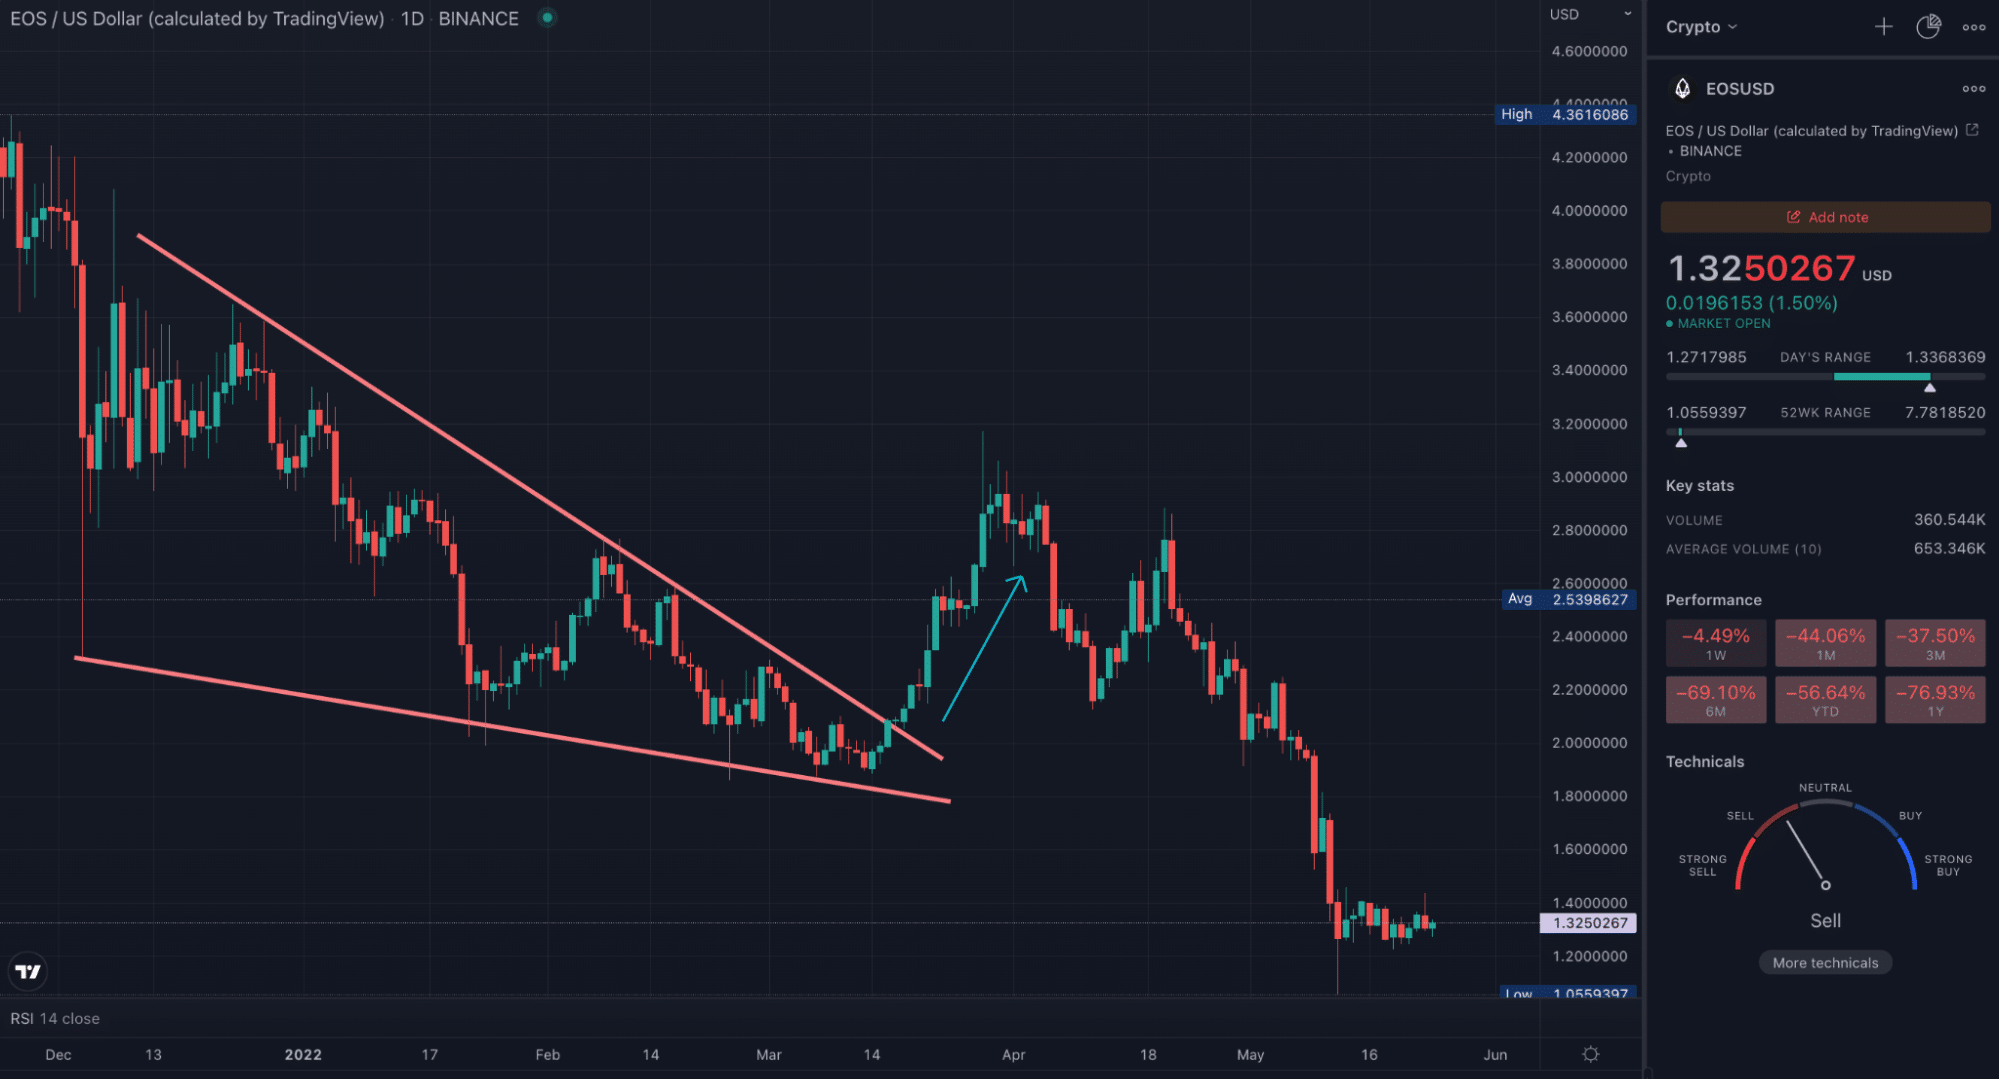
The example below is of the falling wedge pattern, characterized by two converging lines connecting a series of lows and highs at an unequal slope.

Such a formation can be traded as a continuation or reversal pattern. Here, the price ‘squeezes’ tighter and tighter into the wedge. As it gets closer to the corner, there’s an expectation of price explosively breaking out of this range (which it usually does).
With these types of patterns, you can enter into two ways after successfully drawing them on your chart: using pending orders set above or below the trend line (aggressive approach) or waiting for a clear candle close after this point (conservative approach).
The stop loss should sit just right on top or at the bottom of the nearest resistance/support. Generally, traders aim for the vertical height of the wedge for a profit target. However, the price doesn’t always travel this far, meaning you should use discretion and stick to realistic expectations (although it can go even further).
Using indicators
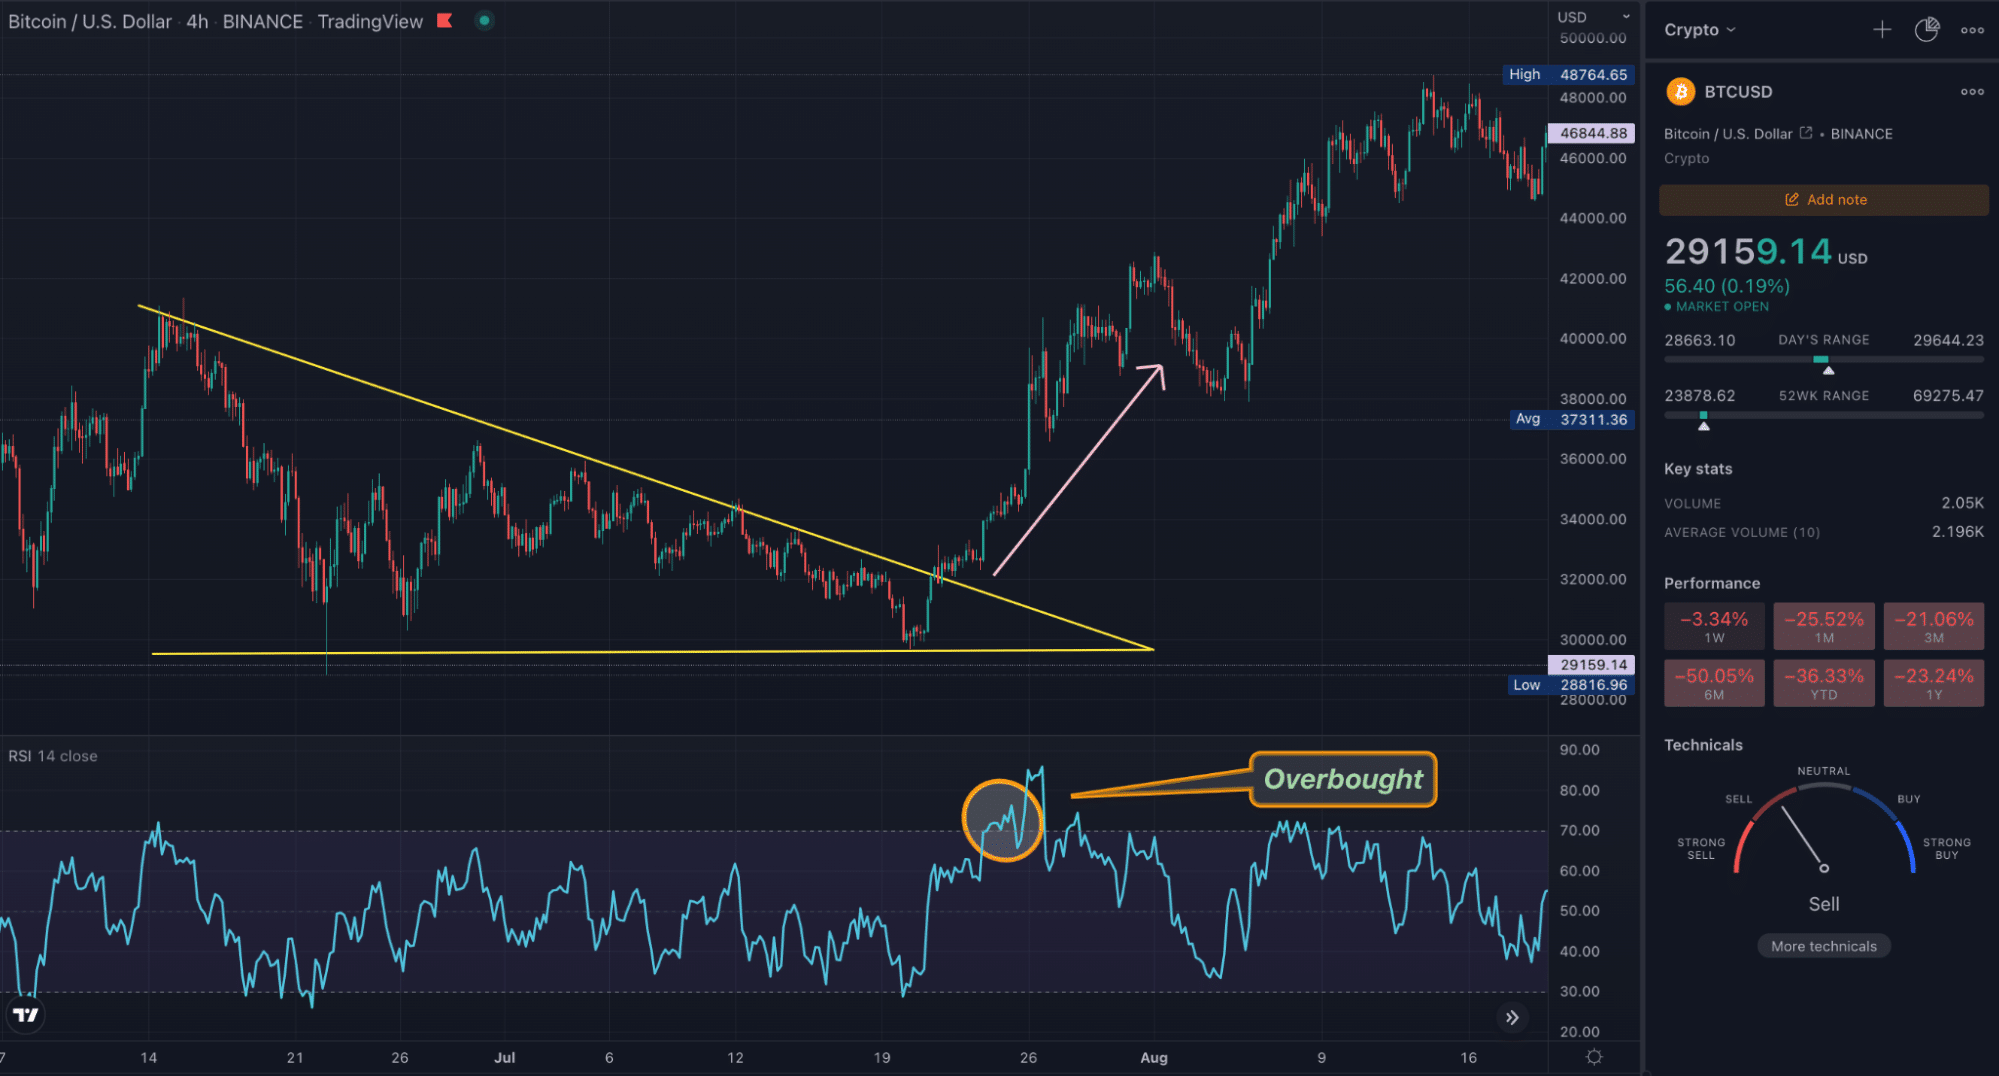
Applying an indicator is essentially a confirmation factor to an existing pattern. In the chart below, we’ve drawn a descending triangle on the 4HR chart of Bitcoin. This pattern is similar to a wedge.

However, it consists of a straight ‘baseline’ (acting as the support) and an ordinary bearish trendline. You can use a tool like the Relative Strength Index (RSI) to confirm the strength of the breakout.
This indicator measures the momentum of a coin’s price. When the RSI goes above 70 (overbought), this signals momentum at its highest. Any confirmed breakout requires massive force, which is where RSI helps. The entry, exit, and profit-taking parameters of triangles are similar to the wedge.
Using fundamentals
Another way to trade breakouts and range-based formations are to use coin-specific fundamentals or the fundamentals driving the crypto market at large. In the latter example, let’s imagine a project is in the middle of a pending lawsuit for a few weeks.
During this period, it’s likely that many people may not be trading the coin due to future uncertainty, causing a ranging market.
Here, you’d find out the lawsuit’s final result; if it’s positive, the price would probably break to the upside of the range (vice versa, of course, if the news were negative). For the overall crypto market, you can study the market sentiment around Bitcoin as it’s highly influential across nearly all coins.
Investors would perform this analysis, having identified ranging formations on their favorite tokens.
Curtain thoughts
It’s understandable why breakout trading is so attractive. When breakouts work well, they produce substantial price movements quickly. Yet, as with any strategy, several flaws exist, most notably the concept of false breakouts.
These are pretty common with this methodology and are not entirely avoidable, especially in a volatile instrument like crypto. Therefore, traders should develop the most conservative entry techniques since how you enter into a breakout forms a large part of whether your positions lose or not.
Alternatively, some may trade the false breakout by placing orders in the opposite direction, which, similarly, is not a foolproof method. Regardless, breakouts and range trading are skills one should study extensively and develop over time.