Pennant patterns are an important tool with which you can technically analyze market behavior. They are distinguishable as compared to other patterns due to the unique cone shape of the pennant. Read further to understand their constitution and how they can help you trade in a bearish and a bullish market.
Understanding Pennant Patterns
A continuous pattern, a pennant pattern, presents itself on the short-term price line for different securities. It is a powerful technique to identify and forecast future trends in the forex market.
This pattern can be found during a strong and lasting uptrend or downtrend. In the pattern, the trend persists for some time and is succeeded by a phase of ‘consolidation,’ which is a period when the price comes to a flat line after observing a strong trend in one direction. Finally, the same trend reappears in the market. Due to initial skepticism, traders hesitate to enter uptrends or downtrends. However, after a steady consolidation period, a higher number of traders enter the game leading to the creation of a triangle-like shape, commonly referred to as a pennant, which is essentially composed of multiple candlesticks.
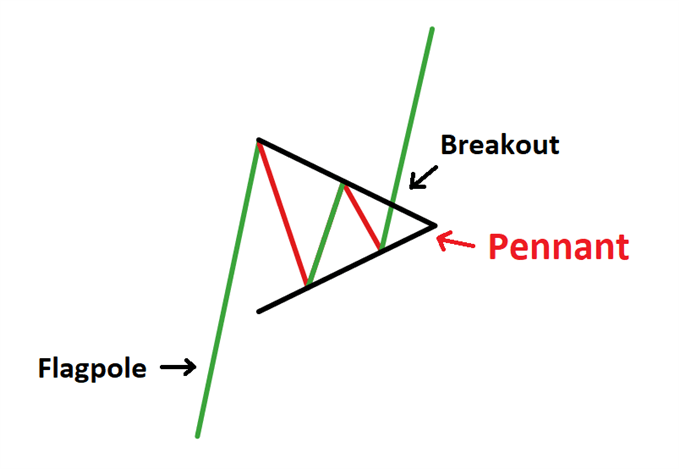
A pennant pattern has certain distinguishable parts:
- As you can see from the figure below, the flagpole part is a signal which appears prior to the beginning of the pattern and is cited as a strong trend towards one direction in the market.
- There are two breakout levels – the initial one appears at the termination of a flagpole, while the second one presents itself post the end of the consolidation period in the pattern. This happens when the initial trend continues in the market. A breakout occurs when the prices of a currency break current support or resistance levels and move beyond it.
- The pennant is easily identified – it appears as a triangle on the whole caused by market fluctuations in the midst of the consolidation and flagpole periods. Along with the breakout levels, the trend lines formed by the flagpole and the consolidation period create points of convergence, which finally make the pennant pattern.
The figure above shows a bullish pattern. The flagpole is represented by an uptrend (green line). The trend breaks into a new level of high on the top and starts falling on reaching a high value. This forms multiple support and resistance levels in the trend. Eventually, when the pennant is achieved, the trend starts moving in an upward direction again.
During an ongoing trend, traders also tend to close their positions midway to prevent any losses, which, in general, leads to a consolidation period in the market.
Understanding Pennant Patterns in a Bullish and Bearish Market
On the one hand, as a strongly rising market for a currency appears, it creates the circumstances for a bullish pennant pattern to show up. This pattern consists of three major components, which are –
- Uptrend depicted by the flagpole.
- Period of consolidation.
- Persisting uptrend.
If you want to trade a bullish pennant pattern, you should try to find the points over the triangle formed by the pennant. The point above the pennant continues as an uptrend, which signals a steady bullish market for investors.
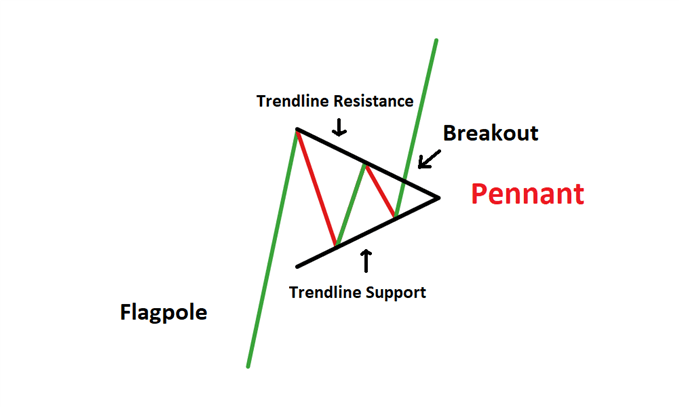
Consider the above example of a bullish pennant pattern. Here, levels of support and resistance that form between the final trend and the flagpole make the pennant pattern. Investors can make use of the breakout level to affirm an upward trend in the forex market.
On the other hand, a strongly falling market for a currency brings a bearish pennant pattern. This pattern consists of three major components, which contrast to the ones shown by bullish patterns. They are:
- Downward trend depicted by the flagpole.
- Period of consolidation.
- Persisting downtrend.
If you want to trade a bearish pennant pattern, you should look for points under the triangle formed by the pennant – it continues as a downtrend, signaling a steady bearish market for traders.
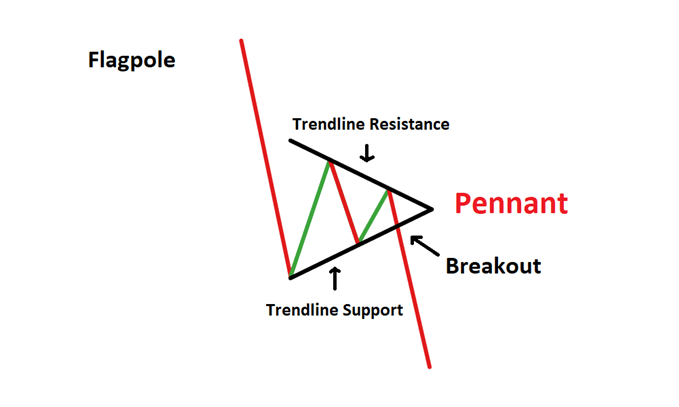
Consider the example above now. Here, the levels of support and resistance formed between the final trend and the flagpole form the pennant pattern. Investors can use the breakout level at the end to verify a downtrend in the forex market.
The trading strategy for bearish and bullish pennant patterns are quite similar. When the price reaches the breakout level, this is a cue for investors to enter the forex market. In such a case, they can enjoy steady trends for a long time. It is a good strategy to set a stop loss at the low of the candlestick appearing at the breakout level.
Note that it is easy to get confused between the pennant patterns and the triangle pattern formed by candlesticks. On the one hand, no flagpole is associated with the triangle pattern, while the pennant patterns start with a flagpole at the initial level. The triangle patterns have also been observed to last for a longer-term than the pennant patterns, and it is imperative for traders to distinguish between the two before entering the market.
Conclusion
An effective tool to spot trends in the Forex market; these patterns are used by investors to predict the strengths or weaknesses of existing trends. This can be helpful to form better trading decisions and strategies as well as to allocate risks. A powerful tool for market analysis, pennant patterns work very well in discovering new support and resistance levels.
These patterns work best with the support of other types of indicators that verify the nature of trends for the investors. To have a healthy trading habit in the market, it is advisable to only rely on the funds you have – use credible resources that can help you with effective risk management and efficient decision making.