Introduction to Bollinger Bands
Bollinger Bands get their name from John Bollinger, the man who conceived the tool. It is one of those tools that traders often rely upon to increase predicting when the market is in an overbought or oversold situation.
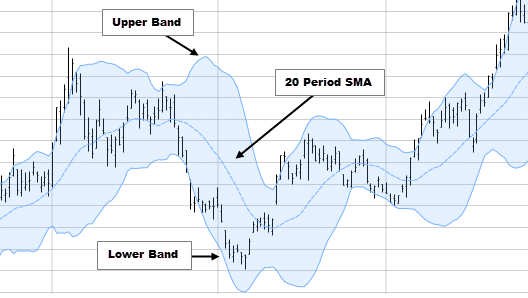
As a technical analysis tool, Bollinger Bands help traders to describe market volatility. The two bands that make up the upper and lower bounds of the volatility channel are derived from the simple moving average (SMA), forming the middle line. In other words, the lower and upper bands represent resistance and support levels of price action.

By default, the SMA covers 20 days. The distance between the upper band and the SMA is equal to the standard deviation multiplied by two. It is also true for the lower band only that this time, the standard deviation product multiplied by two is subtracted from the SMA.
Bollinger Bands have a specific appearance during different levels of market volatility. The bands are closer together, forming some bottleneck when the particular financial instrument’s price volatility is low. However, the bands draw far apart during high market volatility.
Other than market volatility, Bollinger Bands provide traders with information on market trends, especially trend reversal or continuation. Besides, the technical analysis tool tells traders when the market is consolidating, when massive volatility breakouts are about to happen, and notifying traders when the market has hit a top or a bottom.
How do traders calculate Bollinger Bands?
The 20-period simple moving average (SMA) is the core of the indicator. As such, the first step involves calculating the SMA. But how do you approach this task? See the illustration below:
Illustration: Calculating SMA
Calculating the SMA is simple. The data points used for this calculation are the closing prices of the financial instrument in question. For a 20-day SMA, the financial instrument’s closing price for the last 20 days is the first data point. The closing prices are summed up and averaged out to get the first data point. To get the second data point, drop the closing price for the first day and, in its place, pick the closing price for the 21st day. Again, the closing prices are summed up and averaged.
For the sake of illustration, let us calculate a 20-period SMA for the data below. The data is for a fictional financial instrument traded between May 29, 2009, and June 30, 2009, one month. Because the SMA covers 20 days, our first data point will start on June 25, 2009. We then sum up the closing prices from May 29 to June 25 and then divide by 20. To find the next data point, we drop the closing price for May 29 and then add the closing price for June 26. We repeat this process until we have covered all the days under consideration.
| Date | Closing Price | 20-day SMA |
| 29-May-09 | 90.70 | |
| 1-Jun-09 | 92.90 | |
| 2-Jun-09 | 92.98 | |
| 3-Jun-09 | 91.80 | |
| 4-Jun-09 | 92.66 | |
| 5-Jun-09 | 92.68 | |
| 8-Jun-09 | 92.30 | |
| 9-Jun-09 | 92.77 | |
| 10-Jun-09 | 92.54 | |
| 11-Jun-09 | 92.95 | |
| 12-Jun-09 | 93.20 | |
| 15-Jun-09 | 91.07 | |
| 16-Jun-09 | 89.83 | |
| 17-Jun-09 | 89.74 | |
| 18-Jun-09 | 90.40 | |
| 19-Jun-09 | 90.74 | |
| 22-Jun-09 | 88.02 | |
| 23-Jun-09 | 88.09 | |
| 24-Jun-09 | 88.84 | |
| 25-Jun-09 | 90.78 | 86.76 |
| 26-Jun-09 | 90.54 | 86.75 |
| 29-Jun-09 | 91.39 | 86.67 |
| 30-Jun-09 | 90.65 | 86.56 |
Calculating the Upper and Lower Bands
Recall that both the bands that make up the Bollinger Bands’ volatility channel are two standard deviations from the SMA. To get the upper band, you calculate the data’s standard deviation, multiply it by 2 and then add to the SMA. For the lower band, you subtract the product of the standard deviation from the SMA.
From the statistical point of view, the standard deviation is how far a data point spreads out from the average. It can be arrived at by squaring the difference between the data point and the mean and then finding the square root. The resulting value is what you will multiply by two in determining the position of the bands from the SMA.
Overbought and oversold strategy
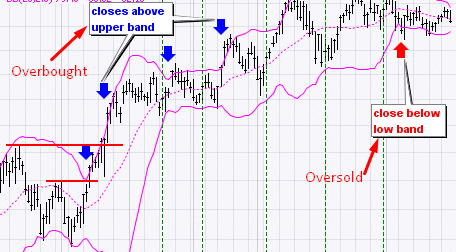
Bollinger Bands behave more like momentum oscillators in terms of the signals they give. When the price breaks above the upper band, this is an indication of an overbought market. Similarly, the market tends towards being oversold as the price advances towards the lower band.

John Bollinger came up with rules that guide the use of this indicator. One of the rules says that an overbought or oversold market indicator does not necessarily amount to a trading signal. Instead, this could be a “tag” whose significance is to point you in the right direction. It means you need to use other indicators to support Bollinger Bands under the overbought and oversold strategy.
Squeeze strategy
The Bollinger Band squeeze strategy is one of the most popular among the users of this indicator. But before we see what this strategy can do, let us mention some default parameters that should be used. The SMA is by default set to 20 days, while the deviation is 2.
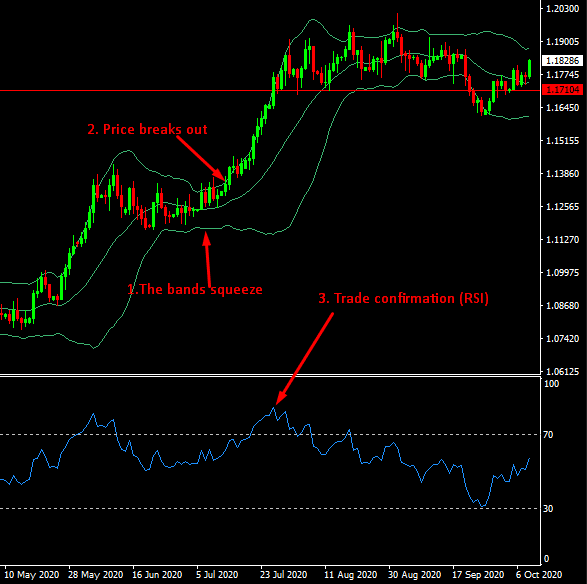
A squeeze is simply the tightening of the distance between the upper and lower bands of the Bollinger Bands indicator. Often, the squeeze happens when market volatility declines. When volatility climbs, the bands draw further away from each other.
The crux of this strategy is that low volatility periods herald higher volatility in the future. There are three steps to this strategy. First, watch out for a squeeze in the bands. Secondly, watch out for a breakout move, i.e., when the price breaks above the upper band or below the lower band. When the break happens, this should signal the beginning of a new move. Thirdly, use a momentum oscillator to confirm the trade set up. In the figure below, we used the Relative Strength Index (RSI), which confirmed that the price action was strong enough to sustain a bull run.

Conclusion
As a technical analysis tool, Bollinger Bands point traders to the right place, that is, to spot consolidations with declining market volatility and more. In his rules for using Bollinger Bands, John Bollinger cautions traders not to interpret overbought conditions for a bearish signal nor oversold conditions for a bullish signal. However, you should always ensure you include a supporting cast of other indicators to point you in the right direction.