In technical analysis, charts tend to give two types of signals – buy signals and sell signals. A buy signal is characterized as an event or condition selected by a trader or investor as an alert for entering a purchase order for an investment. These signals help people to follow a predetermined pattern of trading or investing. Buy signals are used by both short-term and long-term traders. Two of the major buy signals while trading are the high and tight flag and pipe bottoms.
What are pipe bottoms?
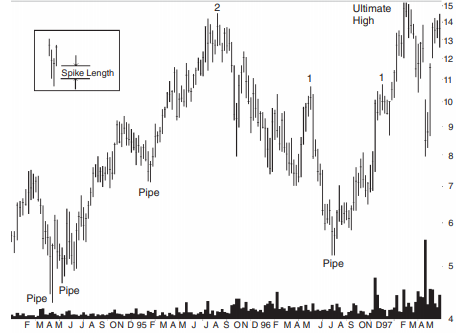
In chart patterns, a pipe represents a pending market correction and an end to a periodic directional move in price. It can signal the end of a broader trend or the end to a retracement of that trend. There are two types of pipes, namely pipe tops and pipe bottoms. A Pipe bottom is a chart pattern that is found in a bearish market. It’s a sign that the selling pressure is decreasing in the market.
How to identify pipe bottoms?
To correctly identify pipe bottoms, you can use the following guidelines:
- Always use the weekly chart to select pipe bottoms. Pipe bottoms on the daily chart do not perform as well.
- Find two downward and adjacent price spikes that appear as parallel lines. The spikes should be longer than other spikes during the past year.
- The bottom of the spikes usually has a small price variation.
- There should be a large price overlap between the two spikes (average: 67%).
- The volumes should be above the 30-day average, 71% of the time on one or both spikes.
- The Pipe should be visually obvious on the chart.
Trading tips for pipe bottoms
As Pipe bottoms are common, one can be selective while using them. Pipes are usually found at the bottom of a price trend, multiple times as part of a V-shaped bottom. This is especially profitable for swing traders. You can switch to the daily scale after the right price spike and buy when the price closes above the highest peak in the 2-week pattern. That will get you in sooner than trading on a weekly basis.
Things to look out for when trading pipe bottoms
To realize the full potential of using this pattern, here are certain things you should look out for when trading them.
- Always avoid overhead resistance on both days as well as weekly scales.
- Tall patterns tend to perform better than shorter ones.
- Pipes with volumes heavier on the left spike than on the right suggests a better performance.
- Always exit your position if the price closes below the lower of the pipe bottom. If things are favorable and the price increases, you can raise your stop to just below the prior valley.
What are high and tight flags?
High and tight flags are considered one of the best performing chart patterns with the highest average rise of 51%, based on perfect trading with no commissions, as well as having the lowest breakdown failure rate of 1%. It’s a bullish breakdown pattern which is designed to signal the start of an upward move.
How to identify high and tight flags?
When using this pattern, you have to look for the following things.
- Price should increase by at least 90% in 2 months or less.
- After the price rise, you have to find a place where the price pauses, which is often sideways or down.
- The volume should always trend downward in the flag.
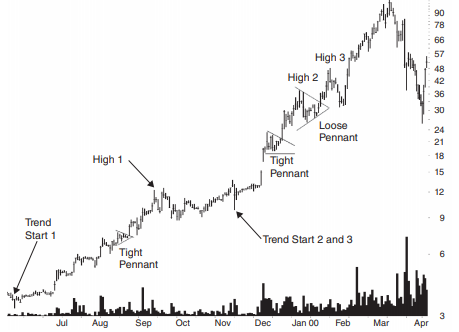
In the chart above, we can see three examples of pennants.
- The first pennant, which occurs in mid-August, is a tight pennant. This means the price touches the trend line boundaries in compact and small crossings. The prices climb by 66% until they reach the peak in September, after which it drops at least 20%, signaling a trend change.
- The middle-high and tight flag occurs in December, and the post-breakout run tops out at the top of the loose pennant (High2) for a rise of 74%. The December pennant is also a tight pattern where price crosses from trend line to trend line in a narrow cluster of action.
- The final high and tight flag occurs less than a month later as price increases to 54% after the breakout at “high 3”. The logarithmic scale might make the large price move appear small.
To find these three high and tight flags, you have to look for a rising price trend that has doubled in 2 months or less. Here, the August pattern reaches its highest peak at the start of the pennant on August 16th, at 7.63. 2 months before the high and tight flag, the price reached a low of 3.78. This represents a rise of 102% in 2 months. The most important rule with this pattern is to wait for an upward breakout or a close above the top of the flagpole or highest peak in the pattern.
Trading tips for high and tight flags
When trading high and tight flags, you should look for the following things:
- Always look for overhead resistance that occurred in the past.
- If a horizontal congestion region appears at the price level above where the asset is trading, it could act as a ceiling.
Once you have identified those things, you can use the following rules for buying:
- Wait for the price to close above the pattern high.
- Buy the asset.
- Place a stop below the prior valley, below the pattern itself, or use a volatility stop.
Things to look out for when using high and tight flags
The following are the list of things to look out for when trading this pattern:
- The most powerful high and tight flags are the ones that retrace 10% to 25% below the top of the high and tight flag.
- High and tight flags with light breakout day volume tend to outperform compared to others.
Final thoughts
There are many chart patterns that generate some sort of buy signal when certain conditions are met when the price moves beyond a certain level. The above buy signals are two among the multitude of signals that traders get from chart analysis.