Volume Indicators are a crucial part of technical analysis – they can make or break any trade, which is why they are a highly celebrated trader’s tools. Experienced traders employ volume indicators to refine their trading skills and form better market strategies. Learn how you can also apply them in real-time to become a more profitable and informed trader.
What are Volume Indicators?
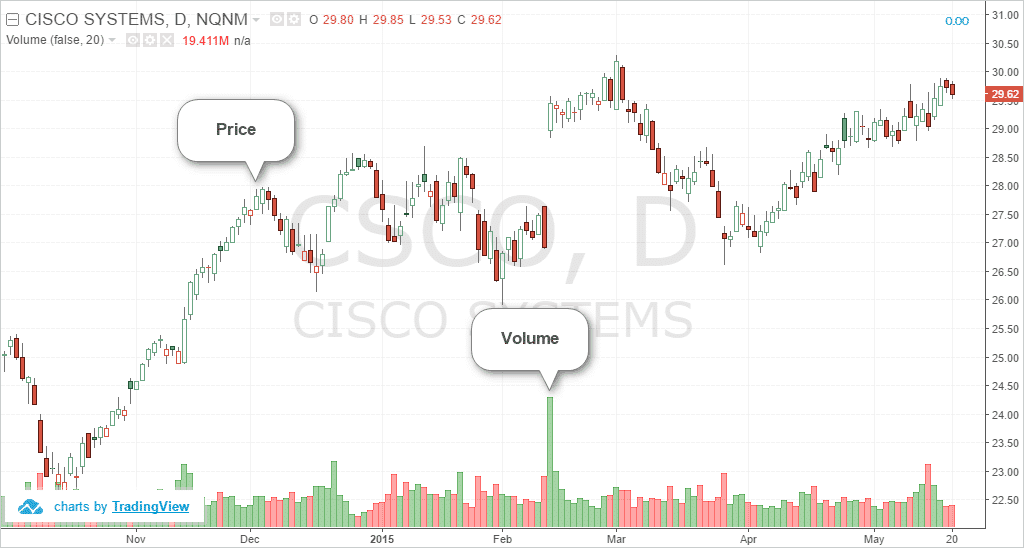
Volume in trading shows the performance and movement of an asset for a given period of time. It tells you the quantity that has been traded for that particular asset. Different measures are used to calculate the volume for various assets. For example, the volume of a stock is the number of shares traded in a given time. For commodities, it is the number of times contracts are exchanged. In forex, volume represents the number of ticks or the daily price fluctuations for currencies that appear in a particular time interval.
A Volume indicator is a tool that measures and analyses this volume for various assets. The value of a volume indicator can tell you about the nature of trends, market scenarios etc. Using these indicators, you can form efficient trading decisions by looking at the tell-tale signs of volume.
- When the volume is large, a rising (uptrend) market is observed to be powerful and secure.
- The opposite is the case for a downtrend. A downtrending market with a high volume represents a strong and steady fall for some time.
- When the market uptrends or downtrends with a low volume, it signals the arrival of a trend reversal or divergences. A trend reversal is when an uptrend turns into a downtrend or vice-versa after moving in one direction for a period of time. Divergences are situations when an asset registers performances opposite of what the indicators suggest.

How do You Use Volume Indicators?
There are many types of volume indicators available for technical analysis. Volume indicators are mathematical formulae that are presented visually. Each type uses a different formula and traders should choose the indicator that best suits their trading strategy and market approach. Given below are a few volume indicators to get you started with the fundamentals of market analysis:
On-Balance Volume:
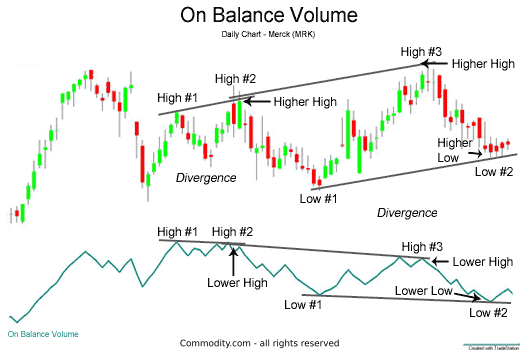
The working of this indicator is quite simple – the indicator registers an increase in the volume when the market closes at a higher price. The value of the volume is reduced when the market closes at a lower price. You can determine the strength or weakness of a trend using the On-Balance Volume indicator. It is also used to notice the arrival of trend reversals and divergences in a trendline. For traders, it is crucial to keep track of reversals and divergences since these changes regularly affect trading strategies and profits earned.

An increase in the On-Balance Volume indicator depicts rising volume that leads to a rise in the price of securities. When the On-Balance Volume indicator falls, the price of securities also tends to fall with respect to the volume.
It can be calculated as –
OBV= Previous OBV + Current Increase in Volume
OBV= Previous OBV – Current Fall in Volume
Chaikin Oscillator:
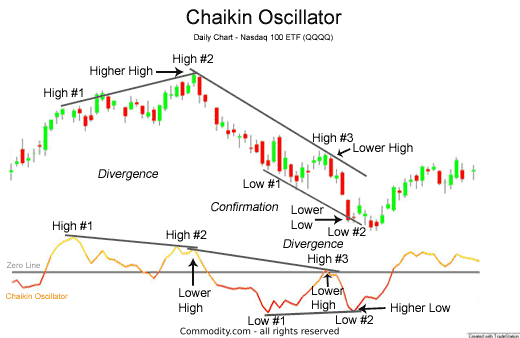
Also called the Volume Accumulation Oscillator, the Chaikin Oscillator uses the exponential values of two moving averages to analyse the volume of trades. A moving average is a continuous trendline that uses average prices to filter out extreme values and market noise. Typically, the two moving averages in the Chaikin Oscillator are calculated for a 3-day and a 10-day period. This indicator is used to highlight price movements and check for divergences in the trendline.
Traders regard the Chaikin Oscillator as superior to the on-balance volume indicator since it takes more variables into account. Where the On-Balance Volume indicator only considers the values above or below the closing price and adds or subtracts that to/from the volume, the chaikin oscillator considers the high and low for the day with respect to the average price. It compares these values to the daily closing price to generate the volume for the day.

Volume Rate of Change (ROC):
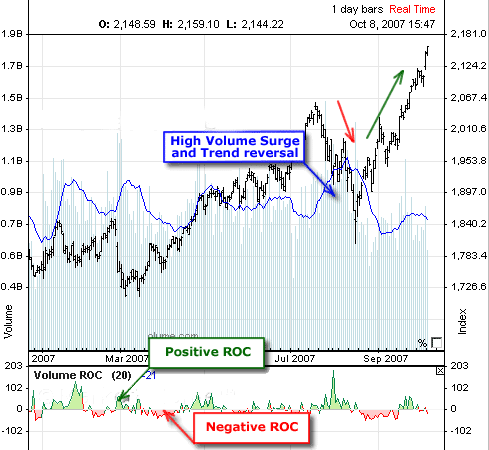
The Volume ROC (rate of change) is an indicator that accounts for the rate of change in price of an asset. It records the fluctuations between present-day and historical volumes. When the volume registers an increase, the indicator moves above the zero line, it moves below the zero line when the volume decreases.
In case of extreme volume growths, the ROC registers an uptrend from the zero line. This is an indicator of a trend reversal caused by a sudden leap in the volume. Although it is easy to see sudden spurts of growth in short periods of time (say 10-15 days), to make the best use of Volume ROC, professionals suggest using the indicator for longer terms of more than 25-30 days. This filters out a lot of larger deviations and extreme values from the trend and gives a smooth chart which is easy to analyse and interpret.

To calculate the volume rate of change, the following formula is used:
Volume ROC = (Current volume – N Period Volume) / N period Volume
Bottom Line
Understanding volume indicators can help you capture markets trends at their best and avoid them at their worst. They inform you about the strength or weakness of a market condition and help you avoid unwanted circumstances. Not only this, volume indicators also allow traders to recognise entry and exit points based on the validity of a trend. Volume is often viewed as an indicator of liquidity and markets with the most volume are sought as the best for short-term trading.
However, despite the reliability of volume indicators, it is best to use them in combination with other technical tools for a comprehensive view of the market. You need a healthy mix of risk management, portfolio diversification and technical analysis to make the best use of tools available and generate regular profits from your trade.