Before we start to write the code, let us give you a birds-eye view of how the code is interpreted to execute your trading idea into an automated strategy. It is an important concept to understand how the environment works. In this guide, our objective is to help you write clean and functional code that runs smoothly without errors and without unexpected behavior. In fact, we can say that robots are “stupid,” and they will only execute orders based on the rules you have defined precisely in the program. You may have your trading strategy in mind, but you need a clear approach to define every single aspect of your trading idea to your robot. The best way not to miss anything is to use flowcharts to model your trading processes. Flowcharts are a series of connected geometrical forms describing the strategic workflow. Let us take an easy example with the EUR/USD simple moving average strategy (fig.8). Flowcharts will give you a visual definition of your strategy, which will help you later in the coding process to construct your robot’s building block the same as a “LEGO construction” (fig.9).
| EUR/USD simple moving average strategy | |
| Event | Trigger |
| EUR/USD cross above the moving average (MA) | Buy EUR/USD or close an existing EUR/USD sell position. |
| EUR/USD cross below the moving average (MA) | Sell EUR/USD or close an existing EUR/USD buy position. |
Fig.8 Example: A simple moving average cross strategy.
To simplify the process, we will just use the three basic shapes of flowcharting, start/end, decision, and process.
| Basic Flowcharting | |
| Start, endA rounded rectangle represents the start/end of a flowchart. |  |
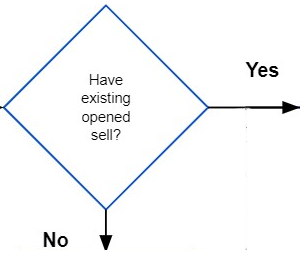
| Decision
A decision is a question that you answer by yes or no and is symbolized by a diamond. |
 |
| ProcessThe process is an action to take once a condition is met, for example, as a result of a decision. |  |
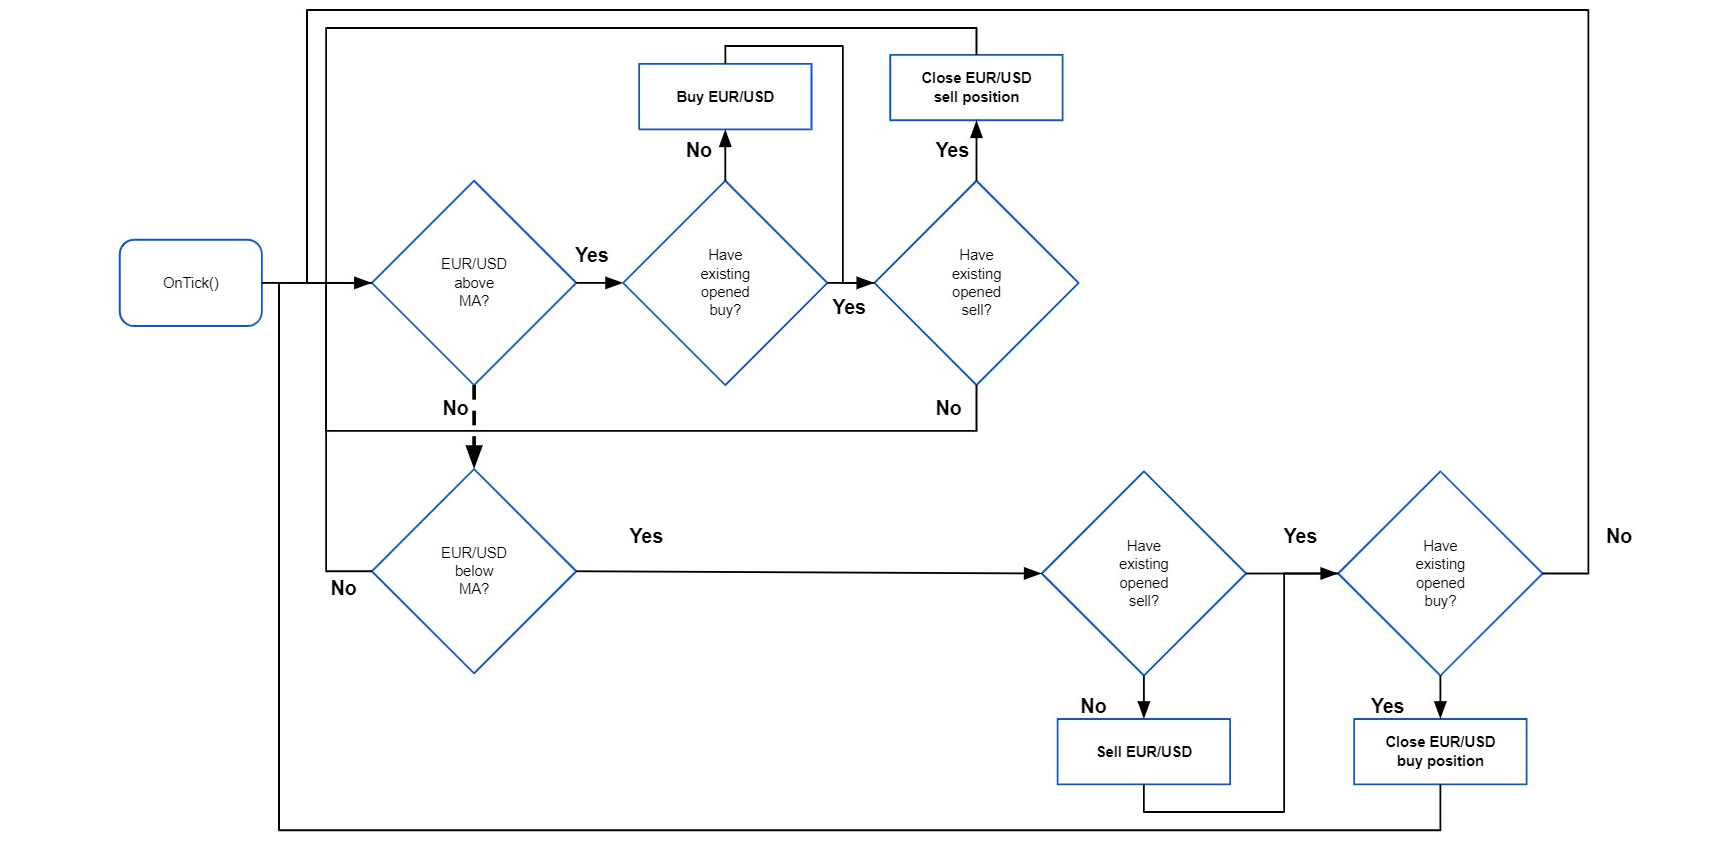
Now that you know how to draw a flowchart try to design one with the trading strategy you have in mind. There is a peculiarity of Expert Advisor you will find at this point: the flowchart is a perpetual loop as the robot will operate until you stop it or interrupt its execution. Fig.9 illustrates exactly this concept.

Fig.9 Visual representation of the EUR/USD simple moving average strategy.