Cryptocurrency is a new and fascinating industry, but it comes with risks for people who want to invest in it. Anyone who considers investing should take into account the momentum. Momentum measures the rate of the rise or fall of crypto prices. The RSI is a popular momentum indicator. It was first established in 1978 by J. Welles Wilder Jr. It evaluates the change in the price over a preset 14-period time frame. However, the time frame can be extended or reduced to suit a trader’s investment horizon. Despite its extensive mechanisms, the RSI is rather simple to use. There are a few strategies that, if properly understood, can help you use them more efficiently.
What is 14-RSI?
RSI is a momentum and speed indicator that shows how quickly the price of crypto is changing. Its output can be used to determine whether crypto is overbought or oversold. Its core is based on the average upward price change vs. the average downward price change during a given period of time.
The default RSI setting for the RSI indicator is 14-periods. This shows the indicator is calculated using the price chart’s last 14 candles or bars. When using a shorter timescale, such as five periods, the RSI is more likely to attain extreme levels (above 70 or below 30). Longer-term timescale, on the other hand, will see the RSI indicator go above 70 or below 30 less frequently.
Calculation
The RSI calculation formula is straightforward. The reason we share the formula isn’t that you’ll have to do it manually; many charting apps already do it for you. We show you the formula so you can grasp the underlying concepts and approach to market data; however, you don’t need to know the exact RSI calculation to trade with it; all you need to know is what it indicates.
Formula

The default settings for this technical instrument are a single line and two levels. The indicator’s vertical axis range is set from 1 to 100, indicating how extreme the present price is in comparison to past values.
Strategies
Overbought
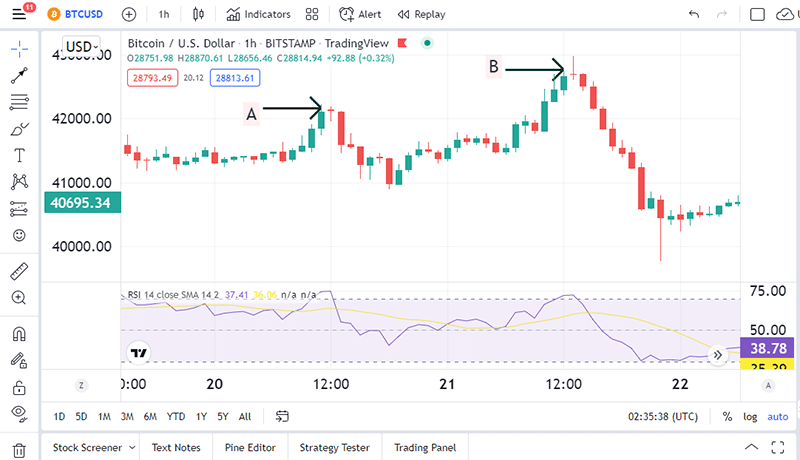
The RSI can assist you in predicting when a cryptocurrency will drop, even if it’s only for a short time. If the RSI is greater than 70, the instrument is considered overbought (a situation whereby prices have risen more than market expectations). The higher the RSI rises above 70.00, the more overbought the asset is, and the more likely the market will correct.

The chart above shows two instances (A and B) where the RSI suggested overbought conditions. The price drops in the next few days or weeks.
Oversold conditions
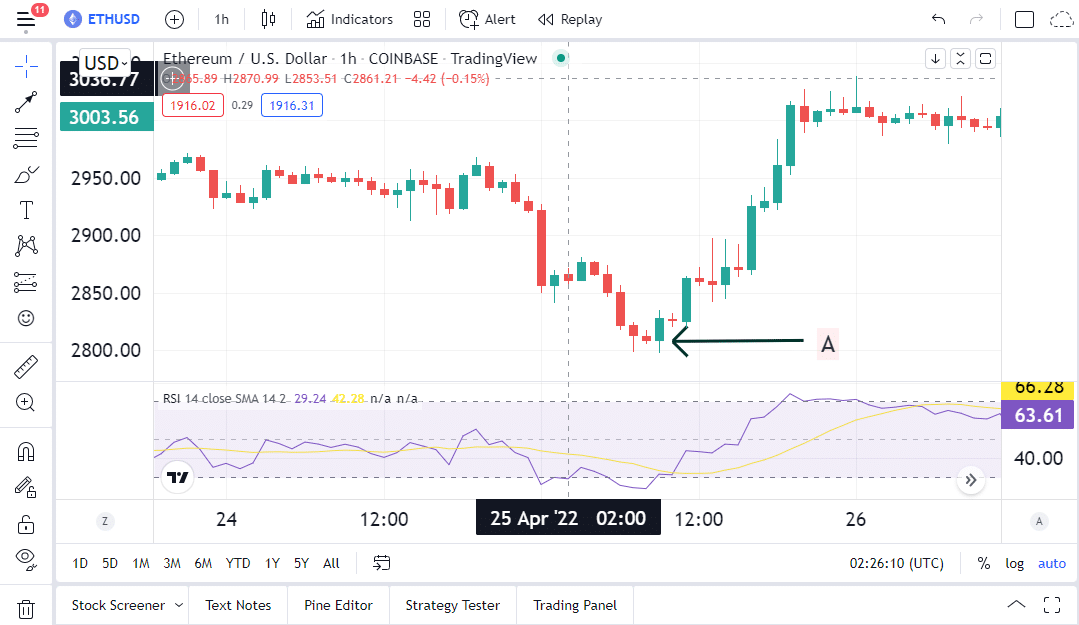
The RSI can also signal when a declining price is about to get exhausted. An RSI of 30 or less indicates that the instrument is likely to be oversold (a situation in which prices have fallen more than the market expectations). The lower the RSI drops below 30, the more oversold the asset is, and the more likely it is to rise in price.

In the 1-hour ETHUSD chart above, at the part marked A, the RSI suggested oversold conditions. The price rises in the next few hours.
Divergence
Divergence occurs when the price reaches a higher high or lower low while the oscillator makes a lower high or lower low. The bearish and bullish positions are indicated.
A bullish divergence signal is indicated by a lower low price and a contrasting higher low on the RSI. This signifies that the cryptocurrency is gaining momentum for an upward move. However, the price movement has yet to reflect this. If you detect a double bottom with a bullish divergence pattern, you could place a buy order.
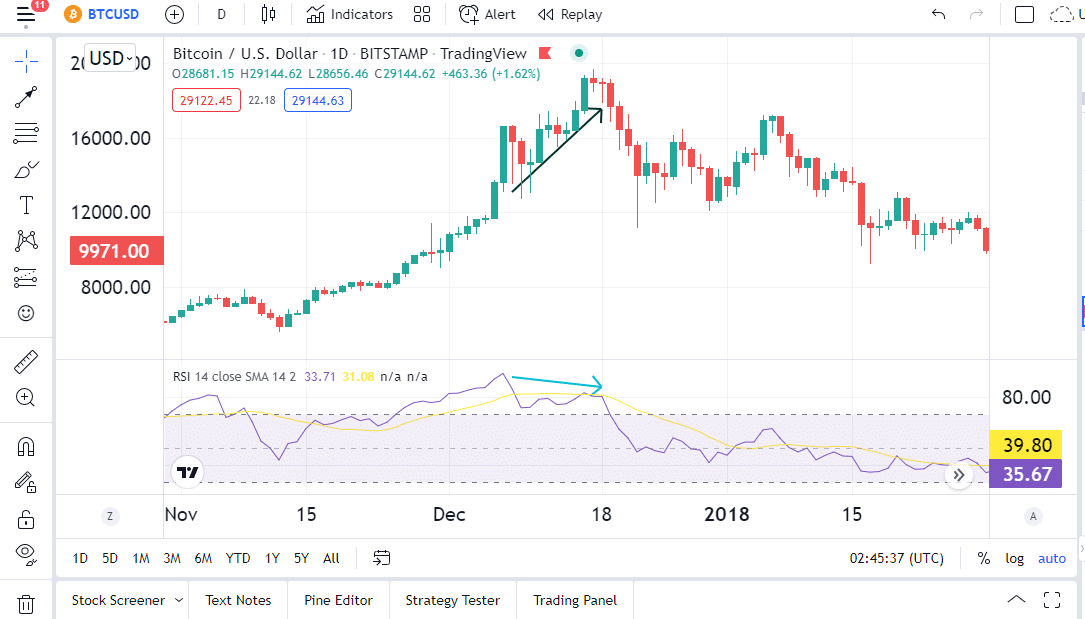
A bearish divergence occurs when the price reaches a higher high while the RSI reaches a lower high. It’s a signal of a price drop to come. It may be wise to sell when a double top shows negative divergence.
We assume that there will be no new bottom; your stop loss can be positioned below the prior low. If a new low is formed, the analysis is incorrect, and your stop loss is reached.

The price (black arrow) is making a higher high, while the RSI is making a lower high in the chart above (blue arrow). This is a bearish divergence, and the price will eventually fall due to insufficient buying power.
RSI 14 trading strategy
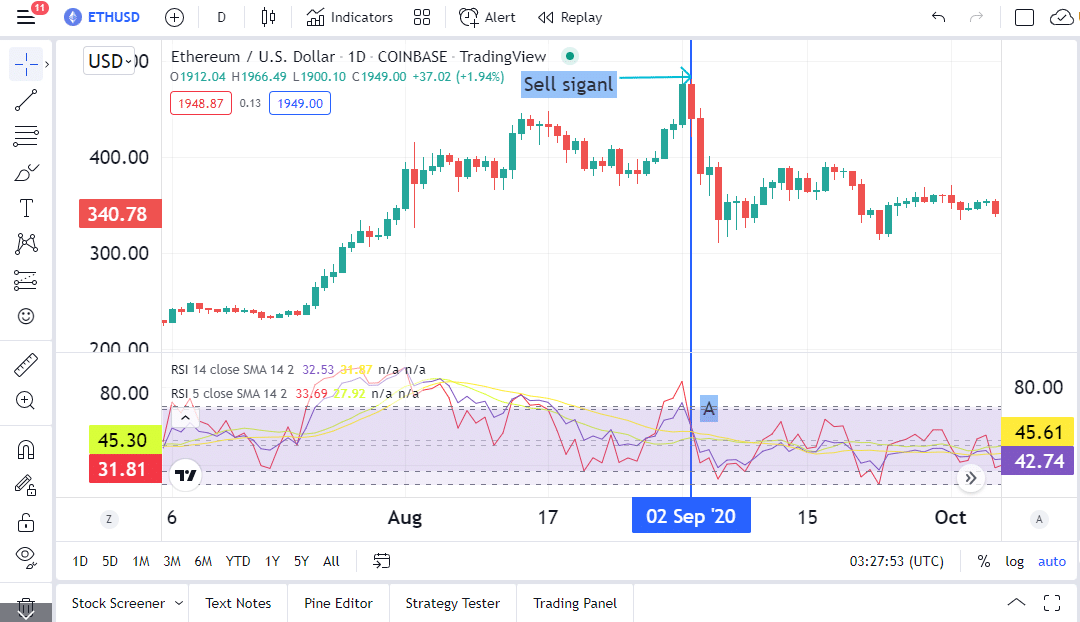
This strategy sometimes is referred to as RSI Two Period Divergence. Apply a 5-period RSI (RSI 5) to the 14-period RSI (RSI 14) and look for crosses. When using the RSI 14 trading technique, the market may not reach oversold or overbought levels before shifting direction. Because a shorter period of RSI is more responsive to recent price fluctuations, it can detect reversals sooner.
When the RSI 5 crosses the RSI 14, it indicates that recent prices are rising. A buy signal is then generated, and a 5 vs. 14 cross should happen when the 5 period is oversold (below 30). When the RSI 5 crosses below the RSI 14 and becomes lower, it indicates that recent prices are dropping. This is a signal to sell. A 5 vs. 14 cross should occur when the 5 period is overbought (above 80).

In the ETHUSD 1-hour chart above, in part marked A, the RS 5 (red line) crosses below the RSI 14 (purple line). This shows that the prices are dropping. Additionally, the RSI 5 was above 80. This is a sell signal.
Summary
On technical charts, the default setting for RSI is 14. When using a shorter timescale, the RSI is more likely to attain extreme levels (above 70 or below 30). On a longer timescale, however, the RSI indicator will go above 70 or below 30 less frequently. RSI is used to show oversold and overbought conditions, bullish and bearish divergence, and when using the RSI 14 and a shorter timescale RSI, you can generate the buy and sell signals.