RSI is the most popular tool for analyzing the market situation for most traders. Calling it an “indicator” is not entirely correct, since it belongs to the group of oscillators. It can be found in the “standard toolbox” of all well-known trading platforms.
What is RSI indicator
RSI is one of the orthodox oscillators for trading on the market. The full name of the indicator is the Relative Strength Index. It allows you to evaluate the strength of a market trend and the current location of correction and pivot points. The main advantage of this indicator is the simplicity of reading and interpreting signals. This is an absolute plus for novice traders.
The fact is that a single curve is displayed on the chart or in the technical analysis window, which allows you to conveniently navigate in the current market situation. The indicator itself compares the absolute values of market growth and decline over a certain period.
The main parameter is the period. Typically, the range of values ranges from zero to one hundred units. For a volatile market, higher values are used to screen out false signals. With quiet trading, the value is underestimated to increase the sensitivity of the indicator and more outlets to enter the market.
History of RSI indicator
The RSI indicator was first introduced in 1978 on the pages of Commodities magazine by J. Wallace Wilder, its creator. He is the author of other tools known to traders, for example, ADX, ATR, Parabolic SAR.
The principles of probability theory are embedded in the RSI operation algorithm; it works on a mathematical calculation of the probability of currency fluctuations. Despite its “complex” internal structure, even a novice trader can easily use it.
The algorithm of this indicator compares two values of the price of a currency pair for the same time interval:
- Price drop level;
- The absolute value of its growth.
The result of this comparison is a curve lying within the range of values from 0 to 100%. The RSI curve constantly moves in a given range, without crossing its minimum and maximum marks, and extremely rarely comes close to them.
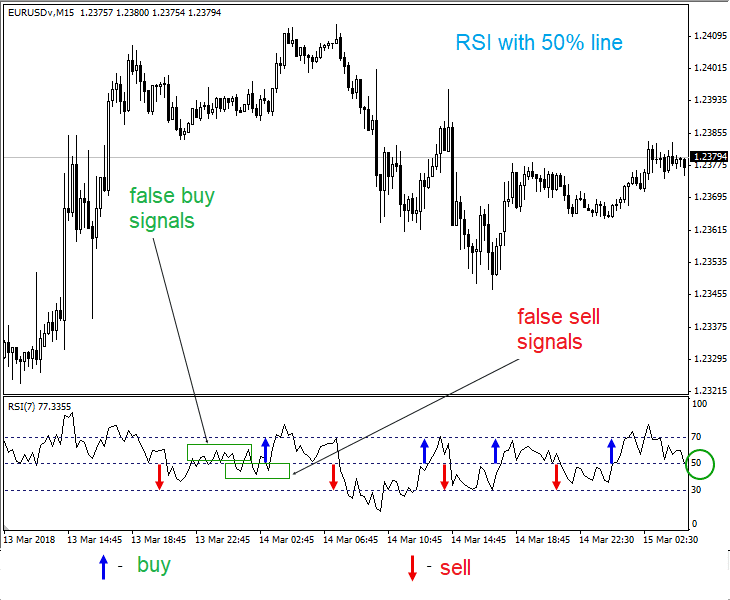
After the RSI indicator is installed, only 2 levels with 30% and 70% marks are visible in its window by default. The average level of 50% can additionally be set manually in the indicator properties. In some cases, the intersection of the curve of this level down / up indicates the trend of prices to decrease / increase.
How RSI can be adjusted, and how is it useful for traders
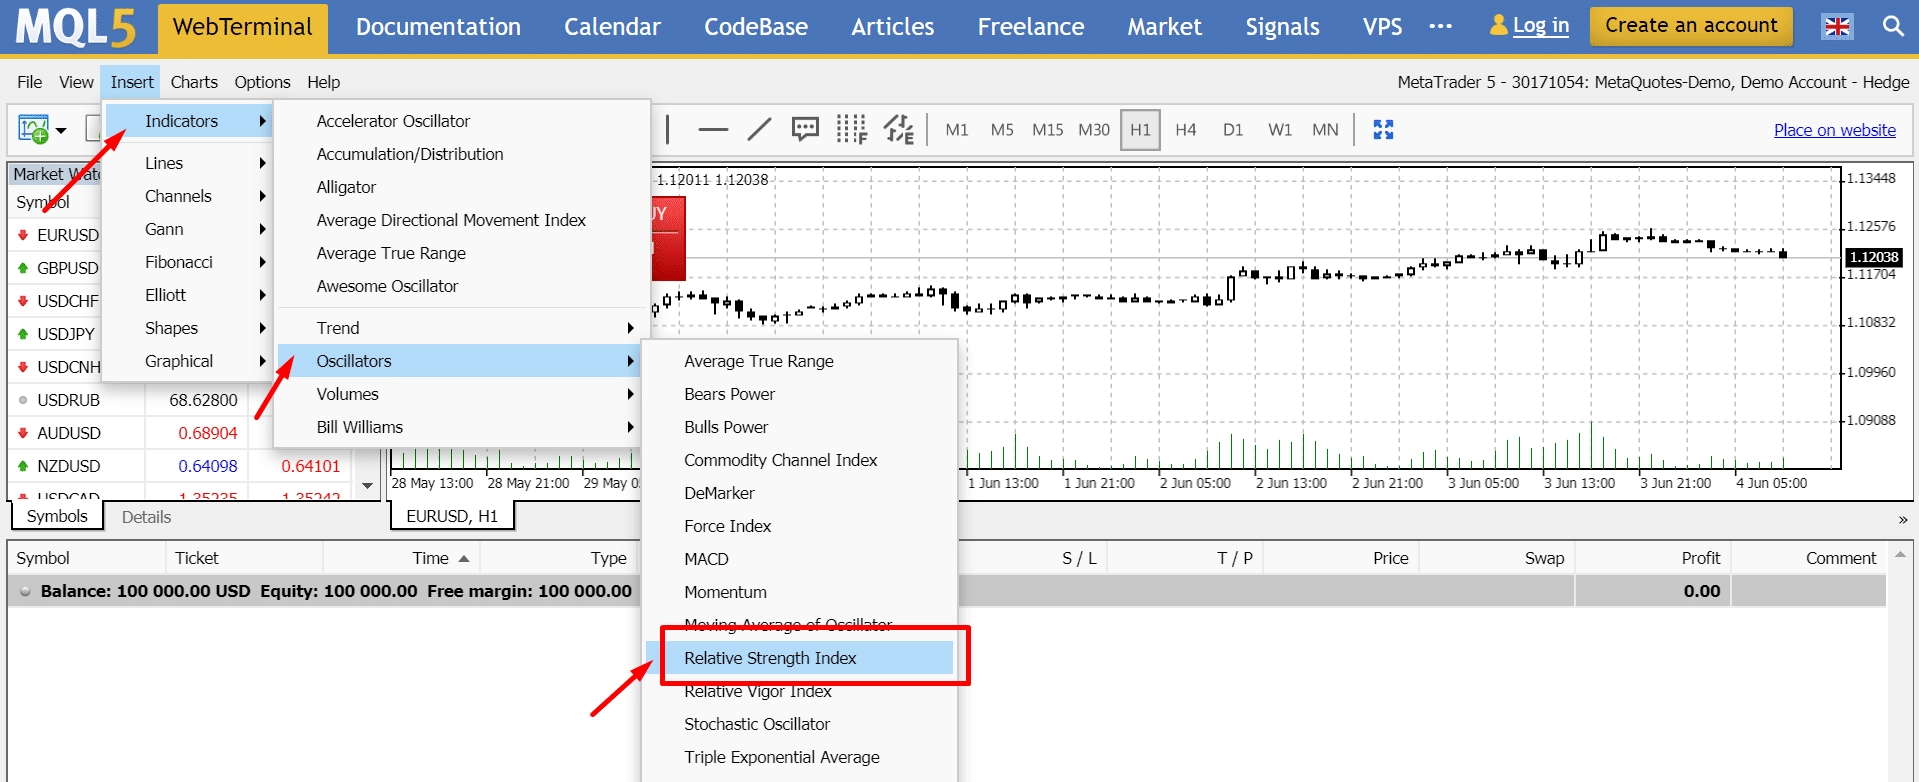
To open the indicator window in the MetaTrader4 terminal, you need to perform a simple algorithm of actions:
- Find the “Insert” menu on the toolbar.
- In the “Insert” menu, open “Indicators”.
- In the “Indicators” menu, select the “Oscillators” group.
- Find the line “Relative Strength Index” and click on it with the mouse.

The indicator will be installed in the terminal and will occupy the position at the lower border of the working window with the chart. You can also use the web version or trading terminal of any Forex broker.
The indicator has one important parameter that shows the frequency of periods and requires adjustment. When installing the indicator, it is equal to 14, but it can be easily changed, given:
- The degree of activity of the foreign exchange market;
- RSI curve in an active market can often cross levels and stagnate for long periods around 30% and 70%.
Given that the RSI indicator was originally designed to work on daily charts and stock markets, the period parameter even needs to be changed. This is especially true for working in the financial market when trading on small timeframes.
Each trader selects indicators for himself, based on the features of his trading strategy. Choose and set the RSI indicator parameters that would not conflict with it. If you know exactly how you will trade, then it is better to use those trading tools that will help you realize your plan. Remember, the strategy is primary, and the choice of an auxiliary indicator is secondary.
On an indicator scale with divisions from 0 to 100, the interval from 0 to 30 is considered an oversold zone, and from 70 to 100 – an overbought zone.
The interval from 30 to 70 on the indicator scale is called the “central zone”. It is important to remember that market entry should be considered when the indicator curve leaves the overbought / oversold zone, and not vice versa. Punching levels, the RSI curve can be in the corresponding zones for a long time. Opening serious positions at this stage of the stay is not recommended.
Basic strategies using RSI
If you plan to use this indicator in your trading, remember that its signals are an entry into the market against the trend. A trading strategy against a trend line is always characterized by an increased degree of risk associated with a probable price correction. Using this tool, you can trade with the trend. Before that, add one more level with the value “50” to the indicator properties.
The trading method from the level of 50% is even simpler. You should trade in the direction of the breakdown of the curve level. For example, if breaking up – we enter with a call, breaking down – we open a position for sale. With a lateral trend movement, this trading system is not very suitable, because with frequent crossing of 50% of the level, the RSI indicator often gives false signals.

Those who have already traded with RSI know that it has one important property characteristic of oscillators – divergence. This term describes the situation in which there is a “disagreement” between the price behavior on the price chart and in the indicator window.
So, if we see two price peaks on the price chart, while the RSI indicator curve in its window draws a decrease in two highs.

This situation indicates that the “bulls” are losing strength, as a result of which one of two things can happen:
- A temporary price correction will occur with the market moving in the opposite direction.
- Will lead to a reversal of the market and the bullish trend will be replaced by a bearish pressure.
A similar situation, but in the reverse order, will happen if two lowering lows appear on the price chart, and the RSI indicator draws them in its window. However, sometimes, using this indicator, the standard value of two lines at 70 and 30 is enough to trade. You can also build a price channel from two lines and observe the price movement.
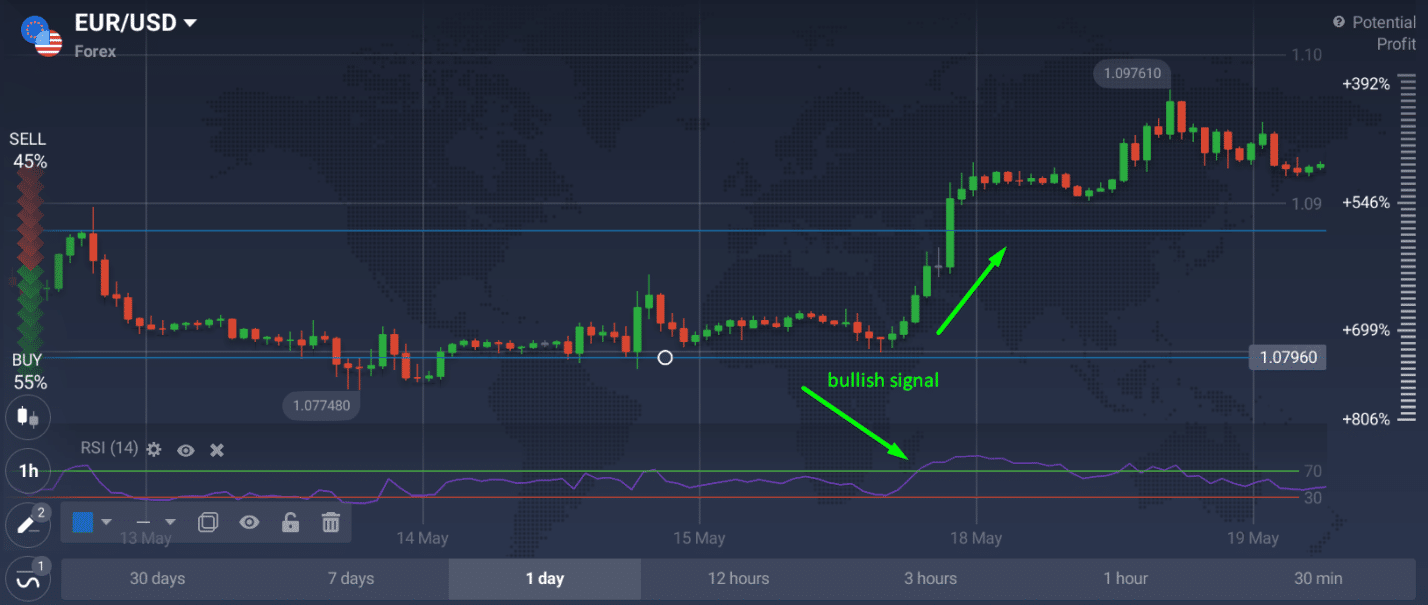
On this figure it is clearly seen that the price of the cover the previous side trend and rushed to the height. You can fix this moment and put it up. This will allow you to earn good money, given that the trend is at the peak of its strength and still does not think to end. The sensitivity can be adjusted depending on how many signals a trader needs to succeed.
Final Words
RSI indicator is quite reliable and shows all price trends thanks to a special technical analysis window. You can observe the actions of the price and make informed decisions depending on the chosen strategy. Also, this indicator can be combined with support and resistance lines and other oscillators.