There are several indicators that are utilized in the financial markets, and naturally, some are more popular than others. The A/DL is not the most popular, but it shows some impressive results when properly inculcated into a trading strategy. Though more commonly used to trade stocks and indices, this tool can also come in handy for many forex traders.
Defining the A/DL
Essentially, A/DL measures the breadth of the market by comparing the stocks that are rallying against those whose prices are declining. Therefore, when more of these stocks are rallying than declining, the resulting A/DL tends to be positive. Similarly, when the stocks that plummet outnumber those that rally, the resulting A/DL tends to go negative.
When applied to the forex market, this tool works in more or less a similar manner. It compares the number of positive candlesticks against the declining candles. If the positive candlesticks outnumber the negative over a specified period, the A/DL is positive. If the red candles outnumber the green, the resulting A/DL is negative.
Functionally, the indicator provides insight into the market sentiment during the chosen period. For instance, if the A/DL declines while prices still make higher highs, it shows that bullish momentum is waning, and a decline may be imminent. Similarly, if the indicator rallies while prices surge lower, it may point to a waning bearish momentum.
How to calculate it
This is one of the simplest indicators to calculate. It only requires three components – the previous A/DL, bearish candles, and bullish candles. For instance, if we’re calculating A/DL on an hourly chart, the previous A/DL will be the net bullish and bearish candles over the previous day. We then subtract today’s bearish candles from the bullish to obtain the net advance, whether positive or negative. We then add this net advance to the previous A/DL to get our current A/DL.
For instance, let’s assume yesterday’s A/DL was 55, and today there have been 18 bullish candles and 6 bearish candles. The resulting A/DL will be computed by calculating the current net advance (18 – 6), which yields 12. We then add this result to the previous A/DL (55 + 12), which yields 67.
Alternatively, there could be 20 bearish candles and 4 bullish ones today. This would yield a net advance of -16. To obtain the current A/DL, we’d add this to the previous A/DL, and since our net advance is negative, this would yield a negative sum, i.e., 55 – 16 = 39. The current A/DL would read 39.
Reading the A/DL
The A/DL tells us the amount of market participation behind a particular movement. When this indicator rises during an uptrend, this is a sign that the rally has a strong momentum behind it and is, therefore, likely to persist. In a similar manner, when it declines during a downtrend in prices, this shows that the bearish trend has a lot of participants behind it, and it may thus push further downwards.
However, if the A/DL line plummets during a price rally, this may signify a potential bearish reversal in the horizon. Similarly, if during a sustained downtrend the indicator makes increasingly higher highs, this could signify the culmination of the current trend. This is because the bears behind the movement are losing momentum and are slowly getting outnumbered by the bulls.
A/DL signal types
The A/DL is an instrumental tool for all classes of traders, be they swing traders, day traders or longer-term traders. All that would differ is the period settings they apply, but otherwise, the use cases remain similar.
To that end, the A/DL yields signals of two types. The first one shows trend strength. As aforementioned, whenever the indicator rises in tandem with prices, it points to a market in a very strong uptrend. Since there are many active bulls in the market, such a move would only be expected to rise higher.
In a similar fashion, if the A/DL line falls in line with prices, the decline can be assumed to be a strong one. Due to a large number of active bears at that moment, the expected move would be a further price decline.

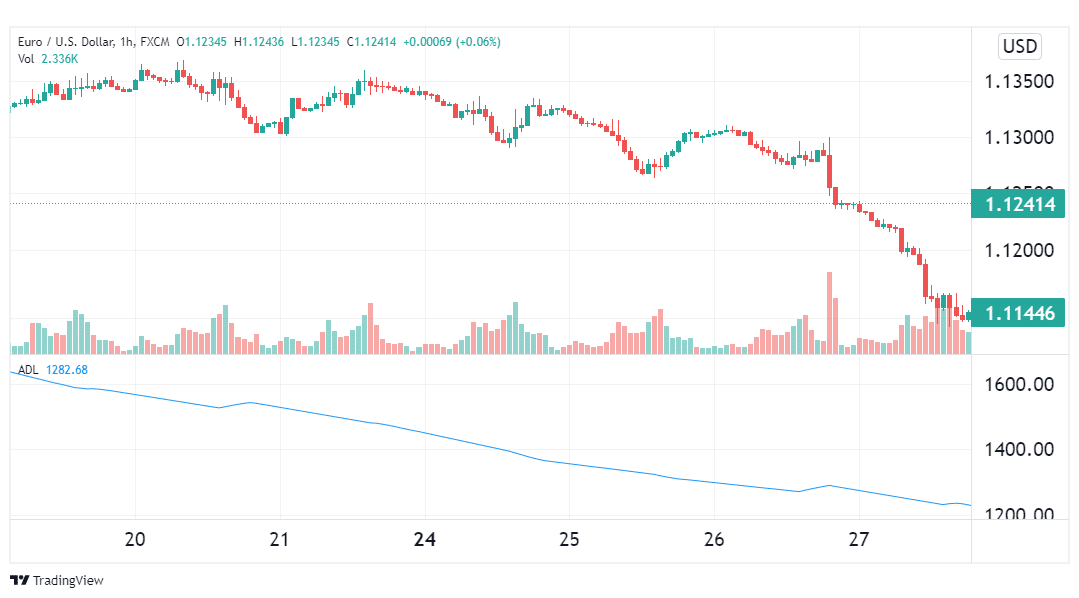
In the illustration above, we see the EURUSD pair in a strong downtrend, which was confirmed by the A/DL. In such a situation, it would be appropriate to enter a short trade whenever the trend stages a price pullback, then wait for a reversal signal before exiting the trade.
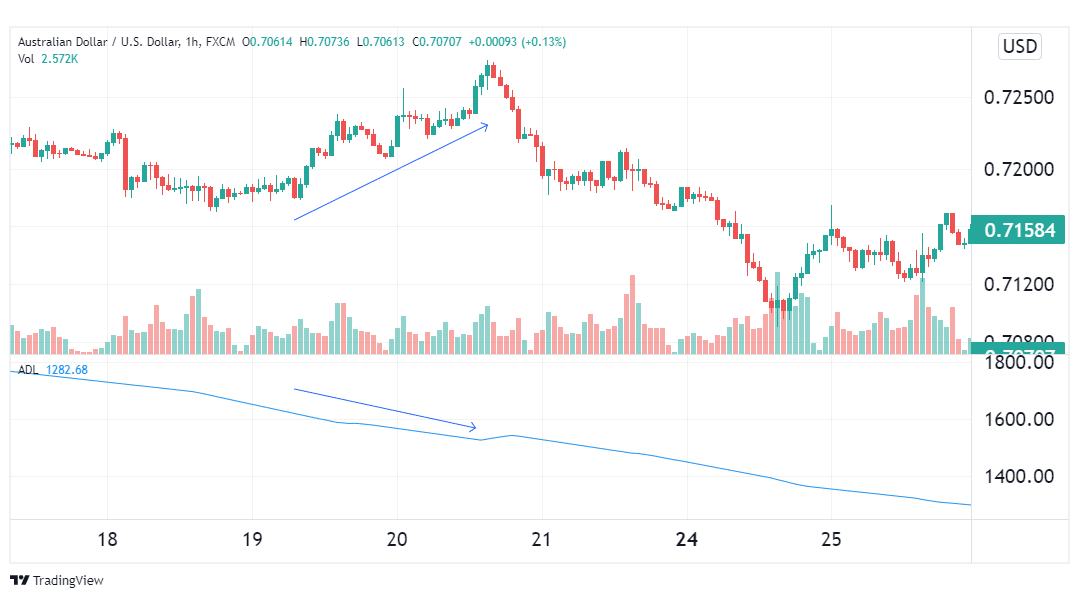
The second signal type that A/DL yields are reversals. It occurs whenever there is a divergence between the tool and the price chart (see the example below).

In the illustration above, the AUDUSD pair was on a rally as shown by the arrow. However, the A/DL was in a downtrend at the same time, introducing a bearish divergence. True to this signal, the pair went on a long, sustained decline.
Conclusion
The Advance/Decline Line differs from other indicators in that it gauges market sentiment by measuring the number of participants behind a particular move. This way, one can tell who between the bulls and bears has the upper hand, which helps to predict future price action. Other than identifying strong trends, this tool can also point out likely reversals through divergence signals.