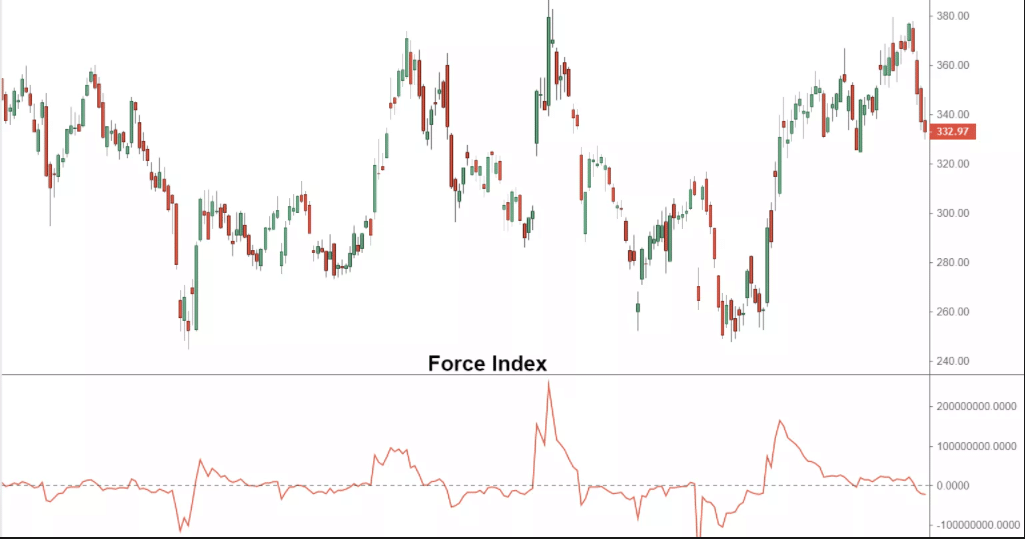
The Elder Force Index (EFI) is a technical analysis indicator that relies on price movement and volume to establish the strength behind price movements. Additionally, the indicator can be used to identify potential reversals in price action while trading. It comes with three key elements: direction, extent, and volume.

By combining direction, extent, and volume, the technical analysis tool fluctuates between positive and negative territory depending on the market momentum. Consequently, it can be used to establish the prevailing market trend and playable corrections. According to Elder, anyone who can identify the underlying market direction and trade in its direction is sure to make a fortune until a reversal comes into play.
The Force Index is calculated by simply taking a previous market close price level and subtracting it from the current close. The resultant figure is then multiplied by the prevailing market volume.
When the Elder Force reading is positive, and the market volume is high, it is a sign that buyers are in control and that price is likely to continue edging higher. Likewise, when the force falls significantly, it indicates that selling pressure is intense and that the asset price is likely to depreciate.
How to use Force Index
While using the Force Index, it is important to pay close watch to the nature of the readings. The readings can either be negative or positive. In case it is positive, it signals bulls or buyers are piling pressure, and that price is likely to continue edging higher. The index will always be positive as long as the prevailing price is above the previous close.
Similarly, when the reading is negative, it is a sign that sellers are in control and likely to continue pushing the underlying price lower. The reading will always be negative as long as the current close is below the previous close.
To avert positive negative crossovers that can make it difficult to make accurate trading decisions, Elder recommends using a 13-period EMA to smoothen the readings.
In addition to positive and negative readings, it is important to pay close attention to the extent, which shows the difference between the previous and current price close. A big advance or a big difference between the two will always signify strong buying pressure. On the other hand, a small difference will show strong selling pressure.
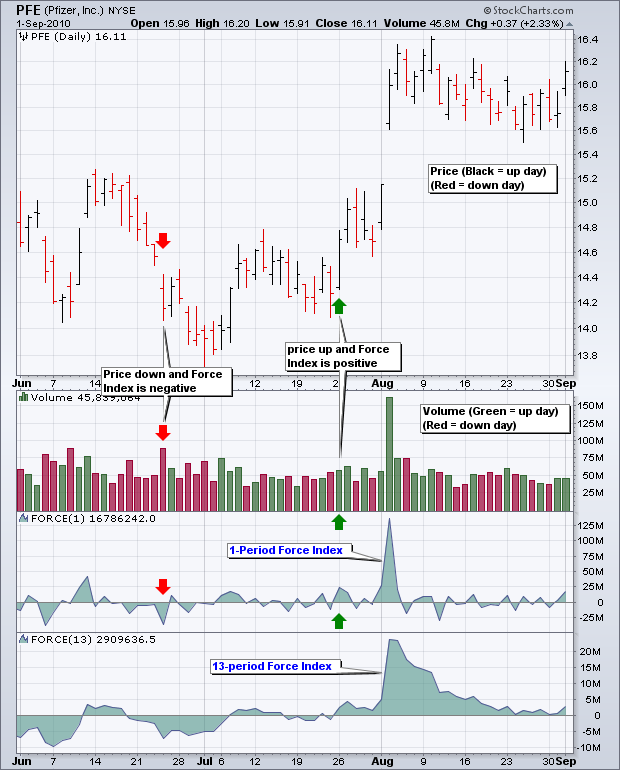
The Pfizer chart below shows that whenever the 1-day and 13-day Elder Force moved above the centerline on huge volume, price raced higher with force, signaling strong buying pressure.

Additionally, volume is an important aspect to pay close watch to while using this tool. A price advance that occurs on huge volumes will always affirm the strength of the buying pressure; whenever price tanks on huge volumes, the same implies that the selling pressure is building up.
In the Pfizer Chart above, whenever the 1-day and 13-day Elder Force moved below the centerline and on huge volume, price tanked significantly, affirming bears in control.
Trend identification with Elder’s Force Index
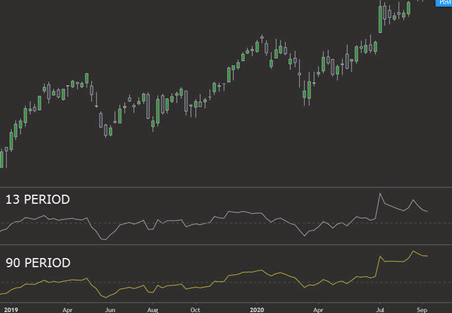
The default EMA used in Elder Force is 12; however, one can alter to use either higher or lower Moving Averages to meet a particular trading strategy. For instance, using a 13 day and 100 days EMA makes it easier to ascertain market volatility.

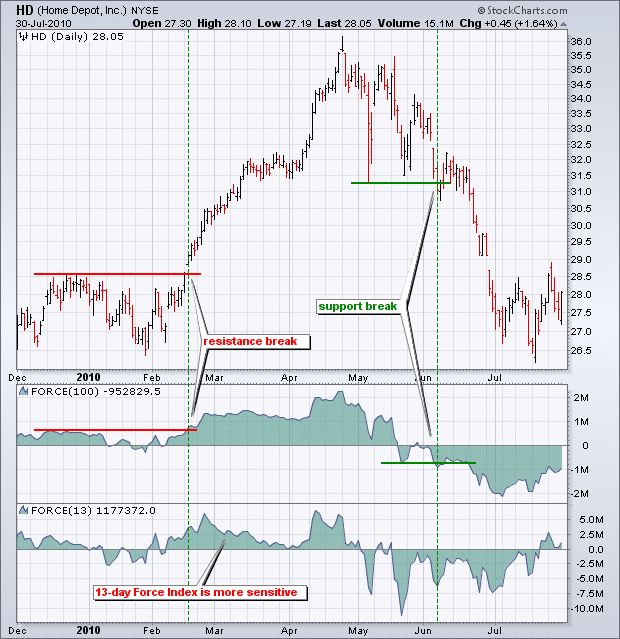
The chart above clearly shows that the 13-day Elder is more volatile, swinging up and down the centerline. In contrast, the 100-day tends to respond slowly to price changes, thus more settled.
In this case, a higher EMA Elder force could be used with certainty to identify the long-term trend as it smoothes out price swings. In the chart above, it is clear that as soon the 100-day EMA moved above the centerline, it signaled the start of an uptrend on the Home Depot on price, breaking the resistance level.
Despite the swings that came into play, the index remains above the centerline, affirming the market was in an uptrend. The end of the uptrend was only confirmed on the Elder 100-day EMA moving below the centerline and price breaking below the support level.
Elder Force Index trading strategy
Elder Force finds great use in confirming market trends in technical analysis. Adjusting the indicator to 13-day and 30-day MA’s, one can ascertain the direction in which the price is trending.

For starters, whenever the Elder Force reading on both the 30-day and 13-day reading is above the centerline, the same signals a buildup of buying pressure. In this case, price is expected to continue moving up as buyers look for entry levels to take long positions.
When the Elder Force indicator moves below the centerline, the same could imply a buildup in selling pressure indicating short-sellers are eyeing opportunities to enter sell positions.
However, the indicator should never be used in isolation to justify the buy and sell signal. When combined with the RSI indicator, one can make informed decisions. For instance, whenever the Elder Force moves below the centerline and the RSI also tanks below the 50 level, the same could act as a strong selling hint.
Similarly, whenever the RSI closes above the 50 level from below, and the Elder Force rises above the centerline, the same should act as a strong buy, indicating it is time to enter long positions.
According to Elder, traders should pay close watch whenever the 2-day EMA of the index turns negative when an asset understudy is trending upwards. If this were to happen, it should act as a buy signal, suggesting it is time to enter a long position above the previous close.
Similarly, one should look to short an asset trending lower whenever the 2-day EMA of the index turns positive as the same signals a buildup in selling pressure probably after a correction.
Bottom line
Elder Force is an ideal indicator for establishing the strength of price movements as it analyzes prices and volume. Additionally, it is used to provide hints on possible turning points at peak and trough levels in price action.