When John Bollinger, the inventor of the Bollinger Bands (BB), was working as an analyst in the 80s, percentage bands were most commonly used. Though these bands were easy to draw by hand, they needed regular adjustment over time. Each adjustment ran the risk of introducing emotion to the analysis process. What’s more, the primary premise behind these bands was inherently flawed – that volatility is constant for each security. John noticed that volatility was actually changing over time, which led him to develop the Bollinger Bands indicator as we know it today.
Bollinger Bands explained
This tool is classified as a volatility indicator, as it measures the highs and lows of a currency pair, or any other asset that’s related to previous price levels. This is achieved by drawing a Moving Average of the price, of which the default number of periods used is 20. However, this can be adjusted to suit the individual trader’s needs.
The Moving Average is used as the middle band of the indicator. To obtain the upper and lower bands, one simply needs to position them at a distance equal to several standard deviations below and above the middle band. The default number of standard deviations used is two. Again, a trader can constantly adjust this number to widen or narrow the distance between these outer bands from their middle counterpart.
How to trade using Bollinger Bands
1. Uptrends
This indicator is very resourceful in identifying uptrends, and gauging how much momentum lies behind these moves. Strong uptrends will manifest as prices regularly touching or breaking past the upper band. Usually, even during an uptrend, prices may stage a decline before resuming the original rally. Such a decline is called a price pullback.
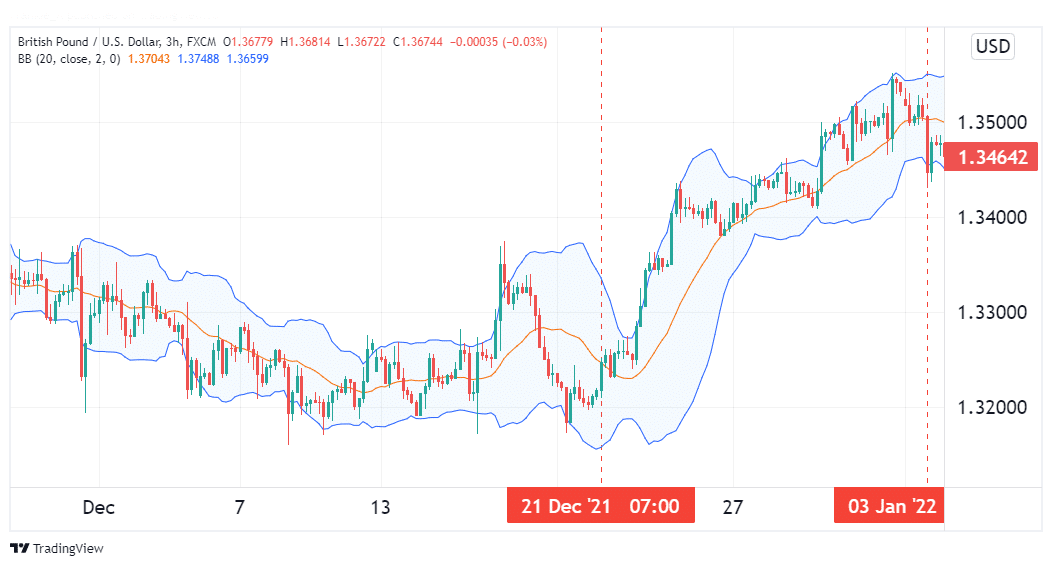
If during an uptrend a pullback occurs and is reversed near or at the middle Bollinger Band, this is indicative of a very strong uptrend. However, if the pullback breaks below the middle band, or even goes as far as to touch the lower band, this should be taken as a sign of a trend reversal in the works. At the very least, it shows that the uptrend is losing momentum and any subsequent rallies are unlikely to break past the middle band.

The illustration above shows our indicator highlighting a strong uptrend on a GBPUSD price chart. Notice how all pullbacks are reversed near or at the middle band for as long as the rally persists. In this scenario, a buy trade would have been prudent when the middle band was first breached from below on 21st December. The sell signal came on 3rd January when prices broke below the middle band to touch the lower band.
2. Downtrends
Bollinger Bands can also be used to gauge the strength of a downtrend and identify when its momentum is fading, which points to the likelihood of a bullish reversal. If prices frequently touch the lower band, it points to a market in a strong downtrend. If any pullbacks are reversed at or near the middle band, it further confirms a high momentum behind the downtrend. However, if prices break past the middle band to touch the upper band, it indicates that the downtrend’s momentum is waning, and a reversal may well be underway.
Therefore, traders should enter short trades when prices breach the middle band from above. The signal to exit such a trade would come from a break above the middle band, and prices touch the upper band.
3. W-bottoms and M-tops
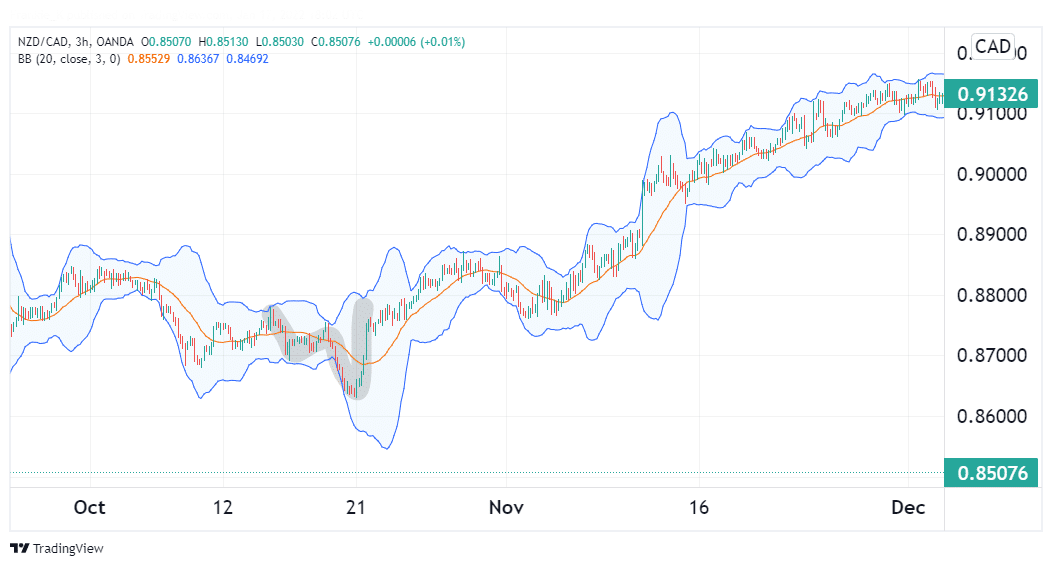
One can also utilize BB to trade W-bottom and M-top patterns. The W-bottom is a pattern that begins when prices make a low near to or on the lower band.

Said prices then pull back to or near the middle band before staging a new downtrend that culminates in a new price low that does not go beyond the lower band. The pattern is considered complete when the subsequent rally surpasses the swing high of the prior price pullback. The image above shows a W-pattern in practice.
M-tops are essentially the mirrored image of W-bottoms. They form when prices rally to or near the upper band, then pull back to the middle or lower. Prices then embark on a new rally that surpasses the previous swing high but does not cross beyond the upper Bollinger band. If prices then drop drastically, reaching the swing low formed by the initial pullback, the pattern is validated.
Traders can utilize W-bottoms to enter long trades, while M-tops can be exploited by shorting a currency pair to validate the pattern successfully.
Shortcomings of Bollinger Bands
Like most tools in the FX market, BB is lagging. This means it is obtained from historical figures, limiting its ability to predict price trends. Therefore, whenever you use these bands, it is advisable to pair them with another non-correlated indicator to help improve the accuracy of your signals.
Additionally, the settings of this indicator are not set in stone. Traders may find that different settings suit various market conditions better. As such, always take time to understand how this indicator fits into your strategy best before trading real money with it.
Conclusion
Bollinger Bands were developed in the 1980s to improve the percentage bands that were popular at the time. They utilize a Moving Average as the middle band and two outer bands equidistant from the MA line. The distance between them is equal to a factor of their standard deviation from the middle band. This tool is helpful in identifying strong rallies as well as downtrends. M-top and W-bottom patterns can also be used to predict incoming price drops and rallies, respectively.