When an investor keeps a position for a protracted period of time, this is known as position trading. Position trading has a wide range of time frames, from a few days, weeks, months, or a few years. Profiting from stronger trends is the primary goal of this long-term trading approach.
How does position trading work?
Position trading can be used in a variety of ways. Technical and fundamental analysis are two of the most used approaches, although there are others as well. It is impossible to make sensible trading judgments without performing these two types of analysis.
Because cryptocurrencies don’t have the same features as traditional assets, fundamental analysis is a little different in this industry. It’s important to note, however, that the main goal of fundamental analysis is to establish the “fair” crypto value and determine whether the cryptocurrency is under or overvalued based on the current price.
Technical analysis, on the other hand, is concerned with examining prices and volumes in order to better time entry. The objective price levels allow crypto investors to set their risk and reward targets and places where they can build a position to meet those goals.
With position trading, you have the possibility to profit from higher price swings on a percentage basis than with other trading strategies, such as day trading or swing trading. As a result, there is more long-term profit potential.
Using technical indicators in position trading
Moving Averages
A long-term position trader can employ a variety of Moving Average techniques. Moving Average crossovers are one of the most common methods for making money in the market.
Position traders use the weekly or monthly chart’s 50- and 200-period Moving Averages for entry and exit signals in this Moving Average-only trading method. Their favorite crossover indicator is the Golden and Death cross. The former refers to when the 50 MA crosses above the 200 MA and is a buy signal. The latter is when the 200 MA crosses above the 50 MA and is a sell signal.
Moving Averages can also be used by a position trader to identify divergences and convergences. It is beneficial to have these indicators. They can signal a change in trend, that is, the beginning of the conclusion of one by increasing or decreasing their HODL, respectively, in entry or exit.
Despite the fact that crossovers and divergences trading lag, they can be employed in conjunction with fundamental considerations to identify potentially trending movements, which can assist the position trader.
Bollinger Bands (BB)
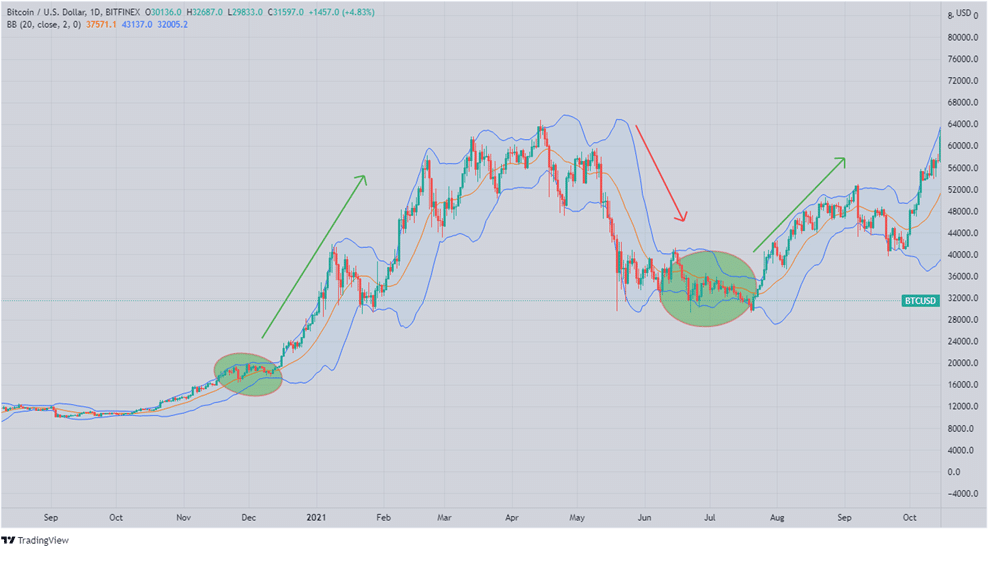
One of the strongest crypto indicators is the Bollinger Bands indicator. The indicator is most effective at detecting changes in volatility in typical trading conditions. The upper and lower BBs can either expand or compress. Compression denotes an impending breakout, while expansion shows rising volatility, as shown on the chart below.

It is also possible to gauge trend strength by looking at how the bars relate to either of the bands. When used in conjunction with other technical indicators, the BB can be useful for spotting trends that are in transition.
On the weekly or monthly charts, a squeeze followed by an explosive bar might suggest the conclusion of a consolidation phase and the commencement of a new trend, respectively.
Position traders can alter their entry/exit points based on this new trajectory, along with project-specific parameters, to commence or finish their multi-weeks/months of HODLing.
Trading breakouts
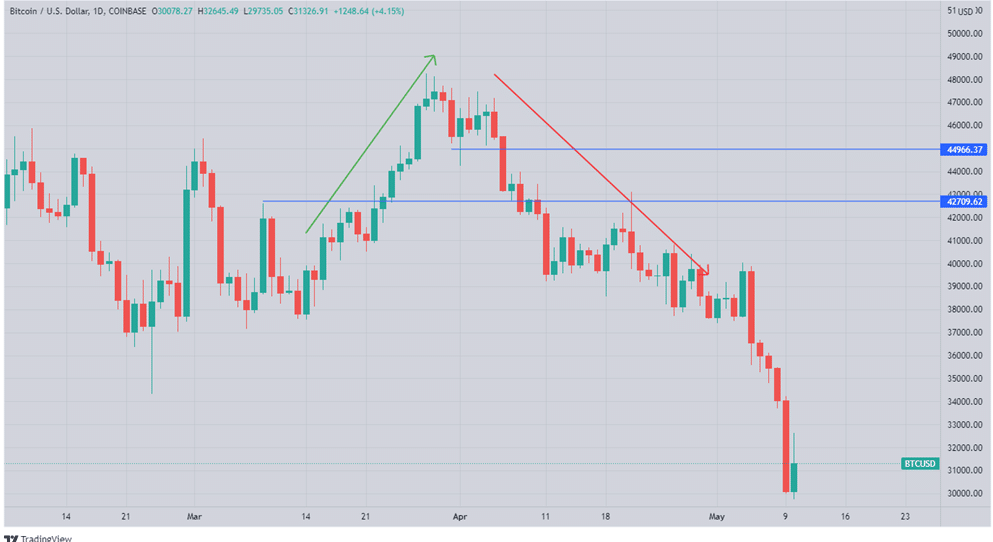
When traders make an entry at the breakout of a swing low or swing high, it means they are using a breakout trading strategy. For example, it could be an all-time high for the month or a significant milestone for the year.
The price should continue rising even after a trader has made their first purchase. If it doesn’t happen, the trade should be closed most of the time.

On the BTCUSD chart above, look at how the BTC surged straight up after breaking the $42,709 resistance and started going down after $44,966 support. There should have been a stop loss placed right below the breakout bar.
Range trading
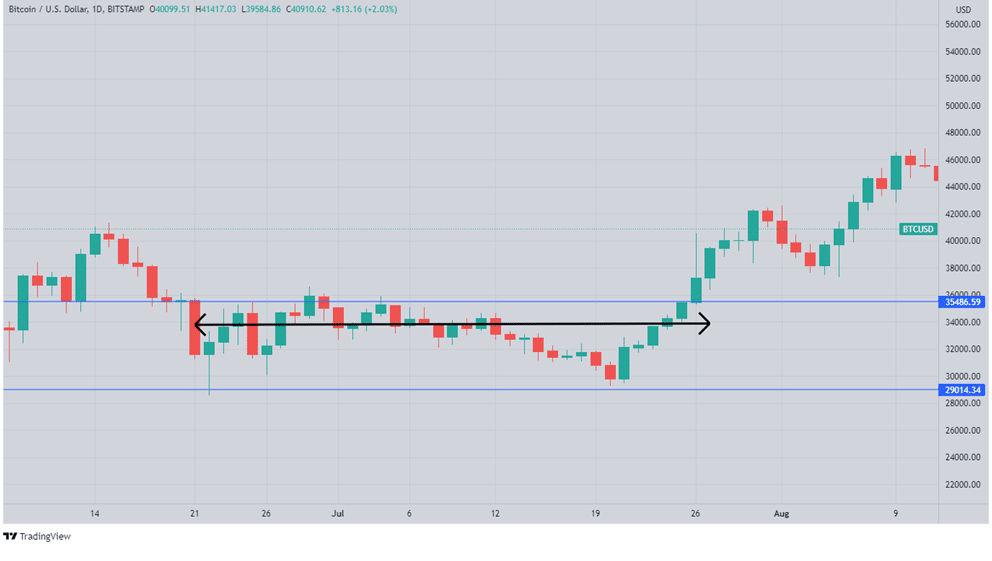
Range trading is a strategy that aims to take advantage of trading opportunities when the price of a cryptocurrency fluctuates between a support and a resistance level. The price zone that exists between the support and resistance levels is referred to as the range by the many technical analysts.
When we see repeated bounces from support and resistance levels, we often have formed a price range. This will appear on the price chart as if the price is “stuck” inside a consolidation and has no obvious path. Position trading’s main goal is to profit from a breakout in the direction of the current trend. Buying the breakout of a resistance level, for example, would be a good idea if crypto is on an upswing.

We can see a well-established range on the BTCUSD daily chart above, which propelled an upward surge as the price surpassed the top limit of the range.
In summary
Position trading is a strategy that enables investors to participate in key market movements and finally beat the returns of the ordinary trader. Retail traders’ best bet in the crypto market is to use position trading, which has a track record of producing enormous gains. This approach saves you the time and effort of performing a detailed technical study. Another benefit is that it takes your mind off the worries that come with everyday price changes.
Patience is required in all of the above approaches. Even when day trading, it’s common to encounter a streak of losses or an early downward trend after initiating a well-reviewed long position. Anything that may go wrong will almost always go wrong. To see if a style is long-term successful, you must persevere through the setbacks. Aim to be correct more often than you are incorrect rather than aiming for perfect accuracy all of the time.