Developed by a Japanese journalist in 1939, the Ichimoku Cloud is one of the few FX indicators that are surprisingly effective as standalone tools. It conveys plenty of information to the trader in just a single glance, a characteristic that makes it seem complicated and untidy to the untrained eye. In this article, we shall demystify this tool so that you can employ it in your daily trades.
Ichimoku Cloud explained
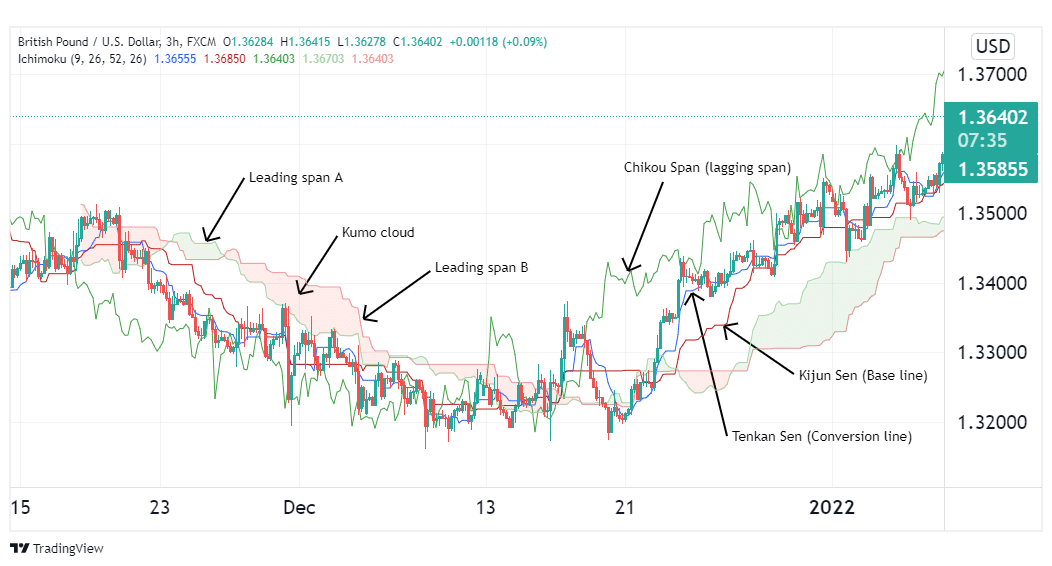
This is a tool that comprises three lines which are based on Moving Averages, and two boundaries enclosing an area called a cloud (see the image below).

All these components are instrumental in identifying trend direction and momentum, as well as pointing out support and resistance levels. Below is a brief breakdown of these components.
- Tenkan Sen/conversion line – This line highlights the midpoint of the last 9 periods. It is calculated by summing the highs and lows of all 9 periods and dividing them by 2.
- Kijun Sen/ baseline – It is representative of the midpoint of the last 26 periods. To obtain it, we simply add the highs and lows of each of the 26 periods and divide the result by 2.
- Chikou/lagging span – This line shows the closing prices of the last 26 periods.
- Senkou Span A/leading span A –This line is obtained by adding the conversion line to the baseline and dividing the sum by two. As the mid-point of the two lines, it forms the upper boundary of the cloud.
- Senkou Span B/leading span B – It is obtained by summing the highs and lows of the last 52 periods, then dividing the total by 2. Essentially, it is displaced 26 periods forward and forms the lower boundary of the cloud.
- Kumo cloud – This is the area enclosed by leading spans A and B.
Trading strategies
1. Trading the Kumo cloud
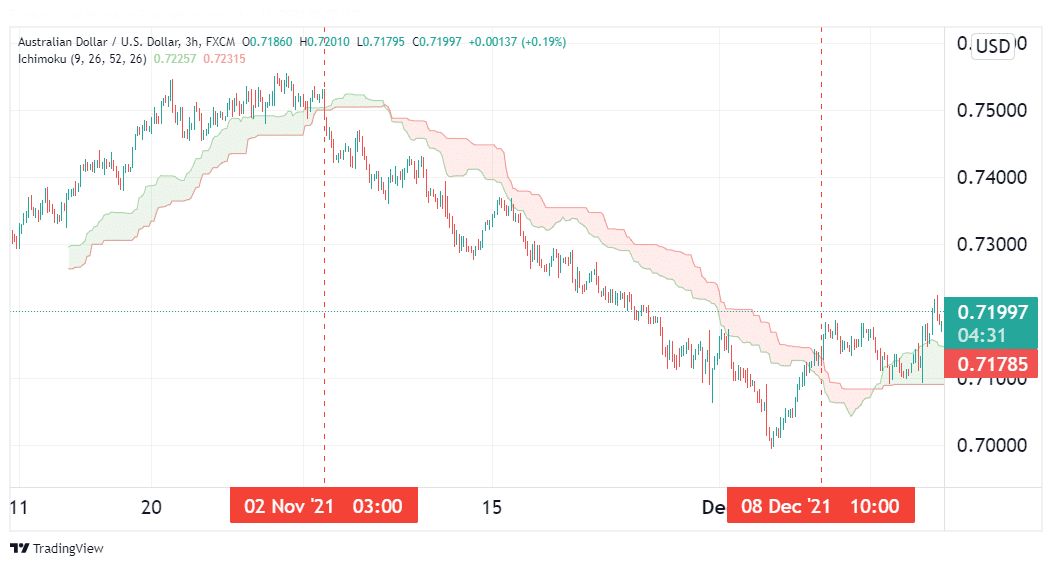
The chart above shows the Ichimoku Cloud in a chart with all its components. It may look chaotic, but there are several ways of obtaining signals from the indicator. One such method is using the cloud to gauge price trends.
To achieve this, we may opt to use the indicator as is or tweak its settings only to display the components we need. The goal is to identify when prices break out of the cloud. When prices trend below the cloud, we will be looking to enter short trades, while prices above the cloud call for long trades.

In the illustration above, a short trade would have been ideal on 2nd November when prices broke past the cloud to trade below it. For more than a month, prices remained below the cloud, and the exit signal came on 8th December when the cloud was breached and prices traded above it.
2. Trading crossovers
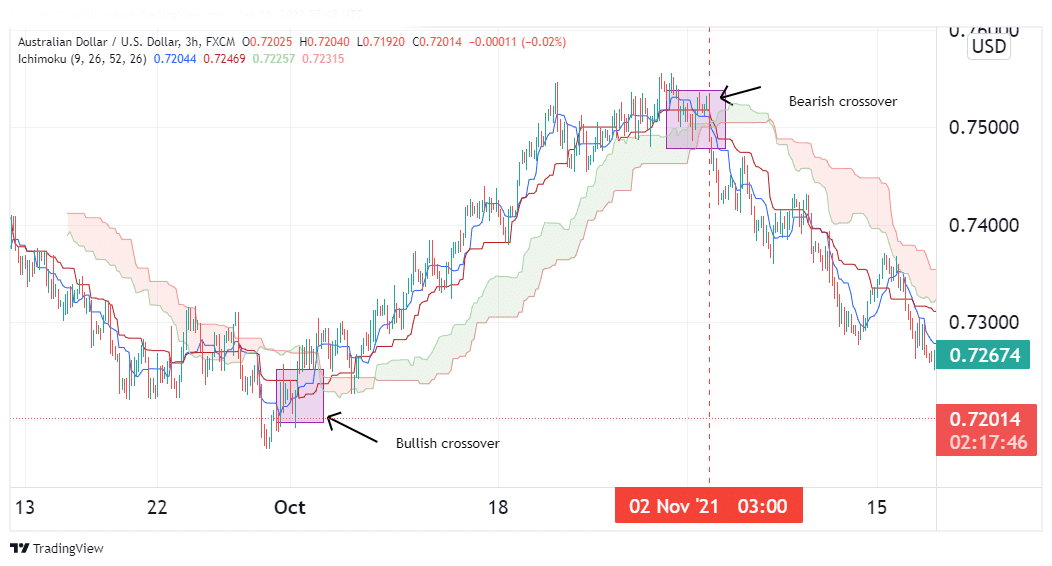
One can also obtain signals by observing crossovers between the blue conversion line and the red baseline. Whenever the conversion line crosses the baseline from below, it points to a market in an uptrend. Similarly, whenever the blue Tenkan line crosses below the red Kijun, it signifies a market in a downtrend.

The illustration above shows a bullish crossover when the Tenkan line crossed above the Kijun at the beginning of October. Soon after the crossover, prices broke above the cloud, confirming the buy signal. The sell signal came on November 2nd when a bearish crossover manifested, and soon after, prices broke below the cloud.
For this strategy, a stop loss should be placed below the breakout candle if we’re trading a bullish setup as the one illustrated above. For a bearish setup, the stop loss should be just above the open of the breakout candle. This is to prevent huge losses if we trade a false breakout.
3. Trading the Kumo cloud and Kijun Sen combination
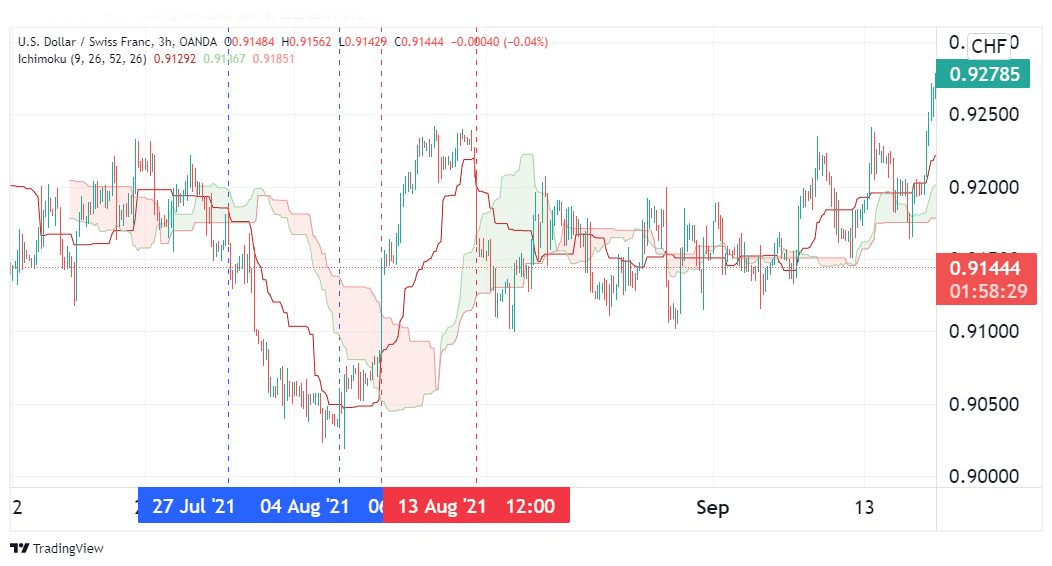
This strategy involves waiting for prices to break out of the cloud and placing the appropriate trade, then waiting for an exit signal in the form of a break above or below the red baseline. For a buy trade, prices need to break above the cloud for an entry signal, and cross below the Kijun Sen for an exit signal. For a short trade, the entry will be marked by prices breaking below the cloud, while the exit will be signaled by a break above the baseline.

The illustration above shows an entry signal for a short trade following this strategy on 27th July. The exit came on 4th August when prices breached the Kijun line, marking the beginning of a bullish reversal.
Soon after, prices broke above the cloud, which gave the entry for a long trade. This trade’s exit signal came on 13th August, when the baseline was breached from above, signifying a bearish reversal.
Pros and cons of the Ichimoku Cloud
Pros
- This tool can be used to display a variety of information, such as the trend direction, the momentum behind it as well as resistance and support levels.
- Due to its complexity, it reduces the number of indicators one needs to utilize on the same chart.
Cons
- It may be confusing to beginners due to the information overload.
- It tends to be chaotic on price charts, which may easily confuse even the most proficient of traders.
Conclusion
The Ichimoku Cloud may seem overwhelming at first glance, especially to novice traders. However, upon learning the functions of each of its components, said traders may find it greatly instrumental in generating accurate trade signals. What’s more, depending on how you choose to use it, you can always hide some of the components to make your chart space neater and easier to analyze.