Any trader, regardless of the financial asset they dabble in, has the sole goal of taking advantage of significant price moves for profit. However, the market, especially forex, in particular, only trends about 30% of the time. So how can one predict these moments of high volatility and get in early enough to make substantial profits? We shall attempt to achieve this with the standard deviation (StdDev) indicator.
StdDev explained
Standard deviation is not a concept that’s native to the financial markets. It was borrowed from mathematics, specifically from the branch of statistics. It depicts the deviation of data points from their average value over a specific period. In forex, this average/mean value is called a Simple Moving Average. Essentially, this tool depicts how far each candlestick’s close deviated from this SMA value, which speaks to the volatility of the market at that particular juncture.
Volatility comes in handy when traders are attempting to identify a trend, and by extension, the trend’s end and the beginning of a reversal. Volatility can also help inform one on the best place to position stop loss orders, as well as profit targets in line with present market conditions.
How to use the stdDev
Typically, when a market displays low standard deviation, it is characterized by low volatility. This means a breakout from the consolidation range may be imminent. If the standard deviation reading is high, the market is highly volatile, and it may soon enter a consolidation phase.
If you apply this indicator to a longer timeframe, you can identify a maturing bull market by identifying swing highs that correspond with low volatility readings. Similarly, if you identify swing highs that are marked with high volatility for short periods, it may indicate that traders are hesitant.
Whenever you observe price bottoms that are accompanied by low volatility levels, it means that traders are generally not interested in the currency pair in question. However, if these bottoms are accompanied by short-lived spikes in volatility, it may point to a panic sell-off by traders.
Points to note
The best timeframe to use with this indicator is anything above 30 minutes. Shorter timeframes are marked with constant whipsaws, which may interfere with the tool’s functionality. You may observe this indicator move horizontally in moments of low volatility, but during higher volatility, it will typically be wavy.
StdDev pros
- It is easy to read. The higher the reading, the higher the volatility.
- It can be used to gauge market sentiment.
- It is based on the mean regression principle – prices tend to revert back to their mean after extreme deviations. This can help traders plan trade setups.
Cons
- It is a lagging indicator.
- It does not show trend direction.
- It is not very efficient as a standalone indicator.
Calculating standard deviation
As aforementioned, standard deviation is a mathematical concept. It can be calculated in the following steps:
- Calculate the average of the closing prices over a specified period. For instance, if the period chosen is 25, sum all the closing prices within that period and divide the result by 25.
- Obtain the deviation of each period from the mean by subtracting the result of step I from each closing price.
- Square each of the deviations obtained in step II.
- Sum the squares of the deviations (results of step III).
- Divide this sum by 25.
- The standard deviation will be the square root of the result of step V.
StdDev trading strategies
1. Breakouts
We mentioned earlier that in times of low volatility, the stdDev indicator would often display flat sections bearing low readings. It follows that if the indicator spikes after a prolonged flat reading, it signifies incoming volatility. This could be a signal to open a trade once the trend starts. Since the indicator does not point out the trend’s direction, you have to wait for the first candlestick to close in the direction of the new trend before entering an appropriate trade. Once that’s done, wait for the indicator to reverse before closing your trade.

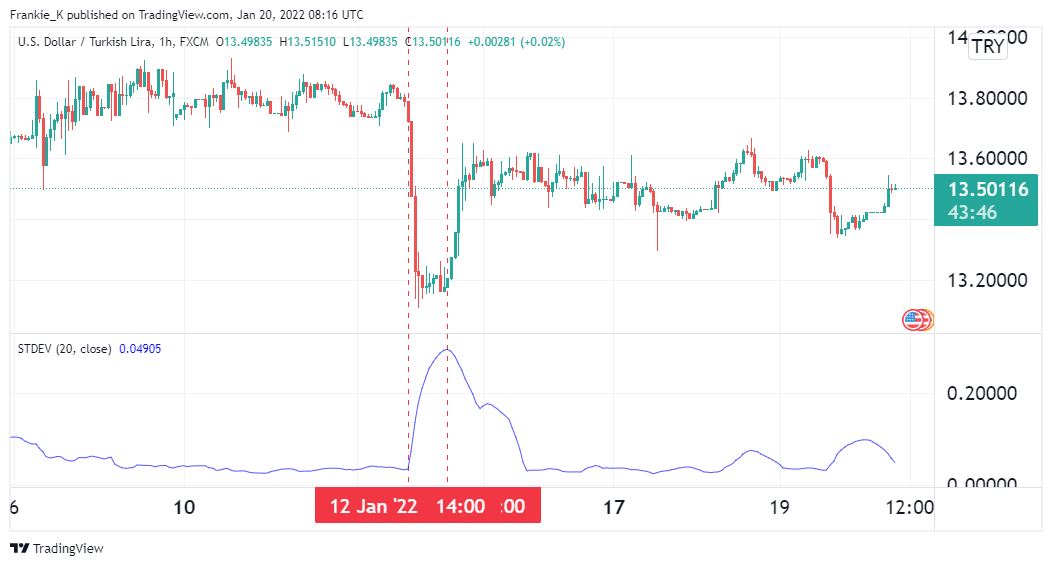
From the illustration above, you can see the USDTRY pair was in consolidation before 12th January. On that date, the standard deviation tool recorded a spike, after which prices began trending downwards. This was the signal to go short on the pair. The exit signal came the next day when the stdDev peaked and began trending downwards.
2. Spotting trend reversals
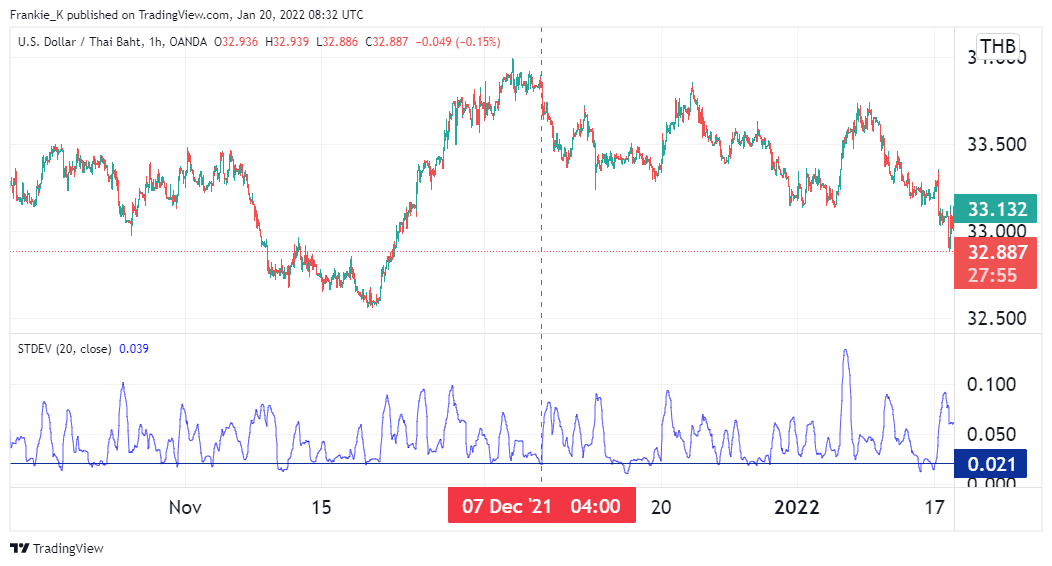
This is a strategy that takes advantage of the wavy nature of this indicator during high volatility periods. It involves drawing a support level on the indicator, where the waves have bounced off several times in the past. During an uptrend, for example, volatility will rise until the trend reaches its peak, where the stdDev line will fall to its support level. If the indicator starts spiking again, this could be a sign of an incoming bearish reversal.

The image above shows an example of such a setup. Similarly, if it spikes after a prolonged bearish trend has reached its trough, it could signify a bullish reversal.
Conclusion
Standard deviation is a mathematical concept that quantifies the variation of data points from their mean over a specified period. In trading, it shows the variance of a candlestick’s closing price from the Moving Average. It can be used to spot breakouts from consolidation ranges, as well as reversals of trends.