TradingView is a leading fintech company that has seen robust growth in the past few years. The firm, which is valued at over $3 billion, has become a favorite among traders and investors because of its excellent charting tools.
TradingView’s platform has several features. It has a social media option that lets people share their trading calls and receive feedback from other members. Further, the platform allows people to open trades from their favorite brokers. Other important features are the economic calendar, technical indicators, scripts, alerts, watchlist, and streams.
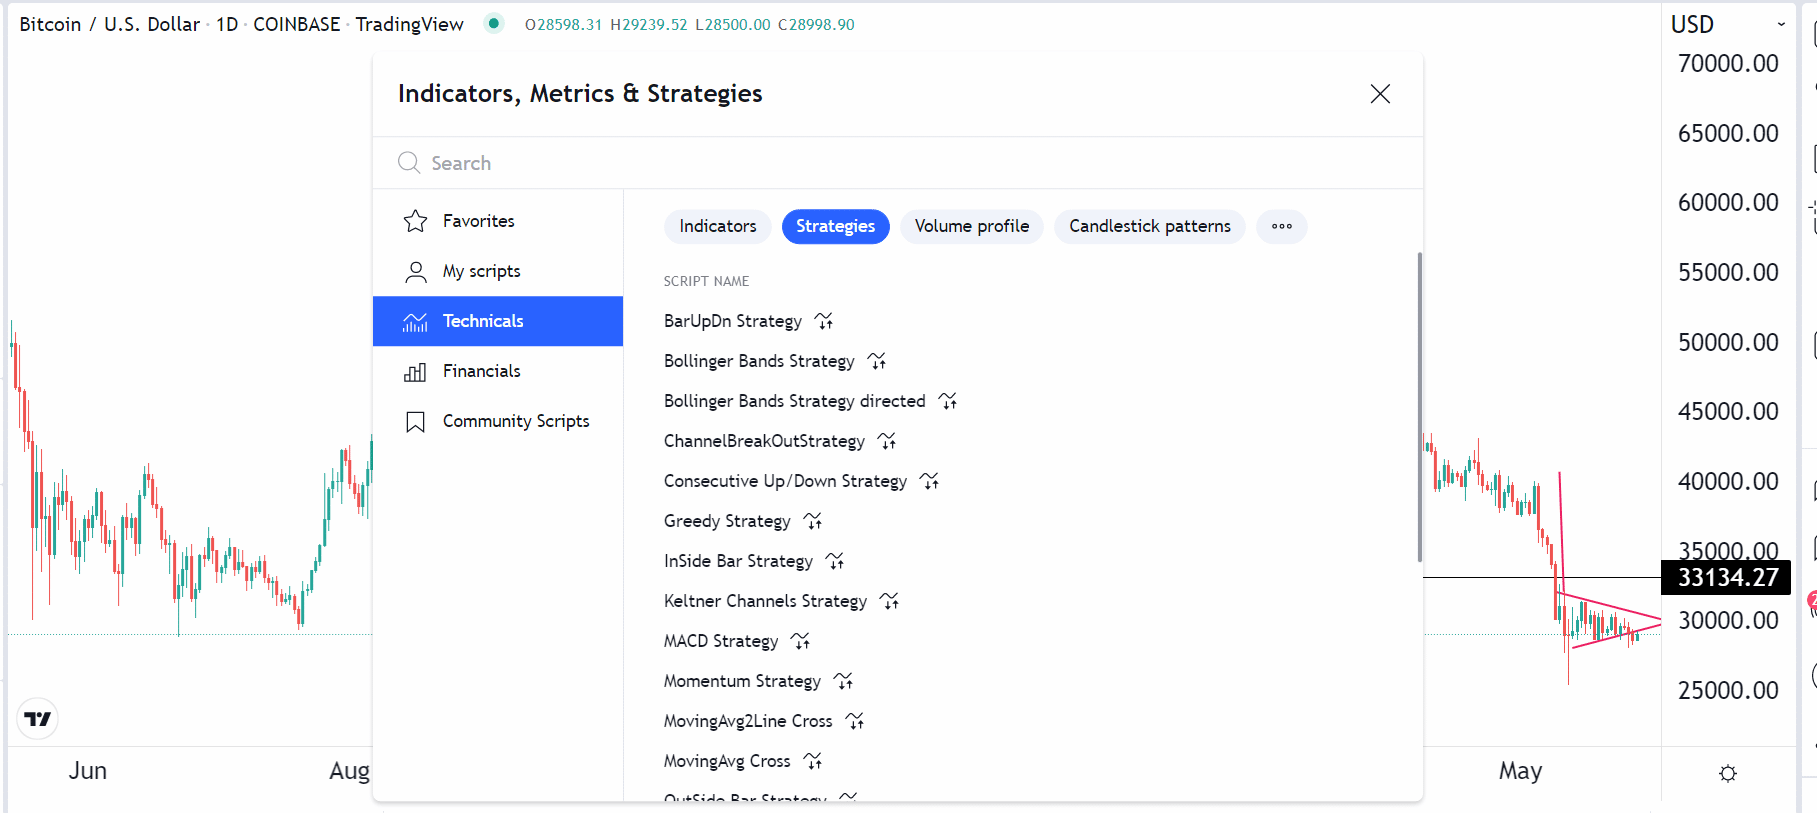
In this article, we will look at the best TradingView strategies that one can use in cryptocurrency trading. Strategies are in-built tools that you can tweak to meet your trading goals. You can access them by selecting the indicator option and then selecting strategies, as shown above.
MACD strategy
The Moving Average Convergence and Divergence (MACD) is one of the most popular indicators in the financial market. It was built to convert Moving Averages into an oscillator, which one can use to find overbought and oversold levels. It has two lines: fast and slow Moving Averages.
There are several approaches to trading the MACD indicator. One of the most common is to identify when the two lines make a crossover below and above the neutral line. A bullish signal emerges when the crossover happens below the neutral line and vice versa.
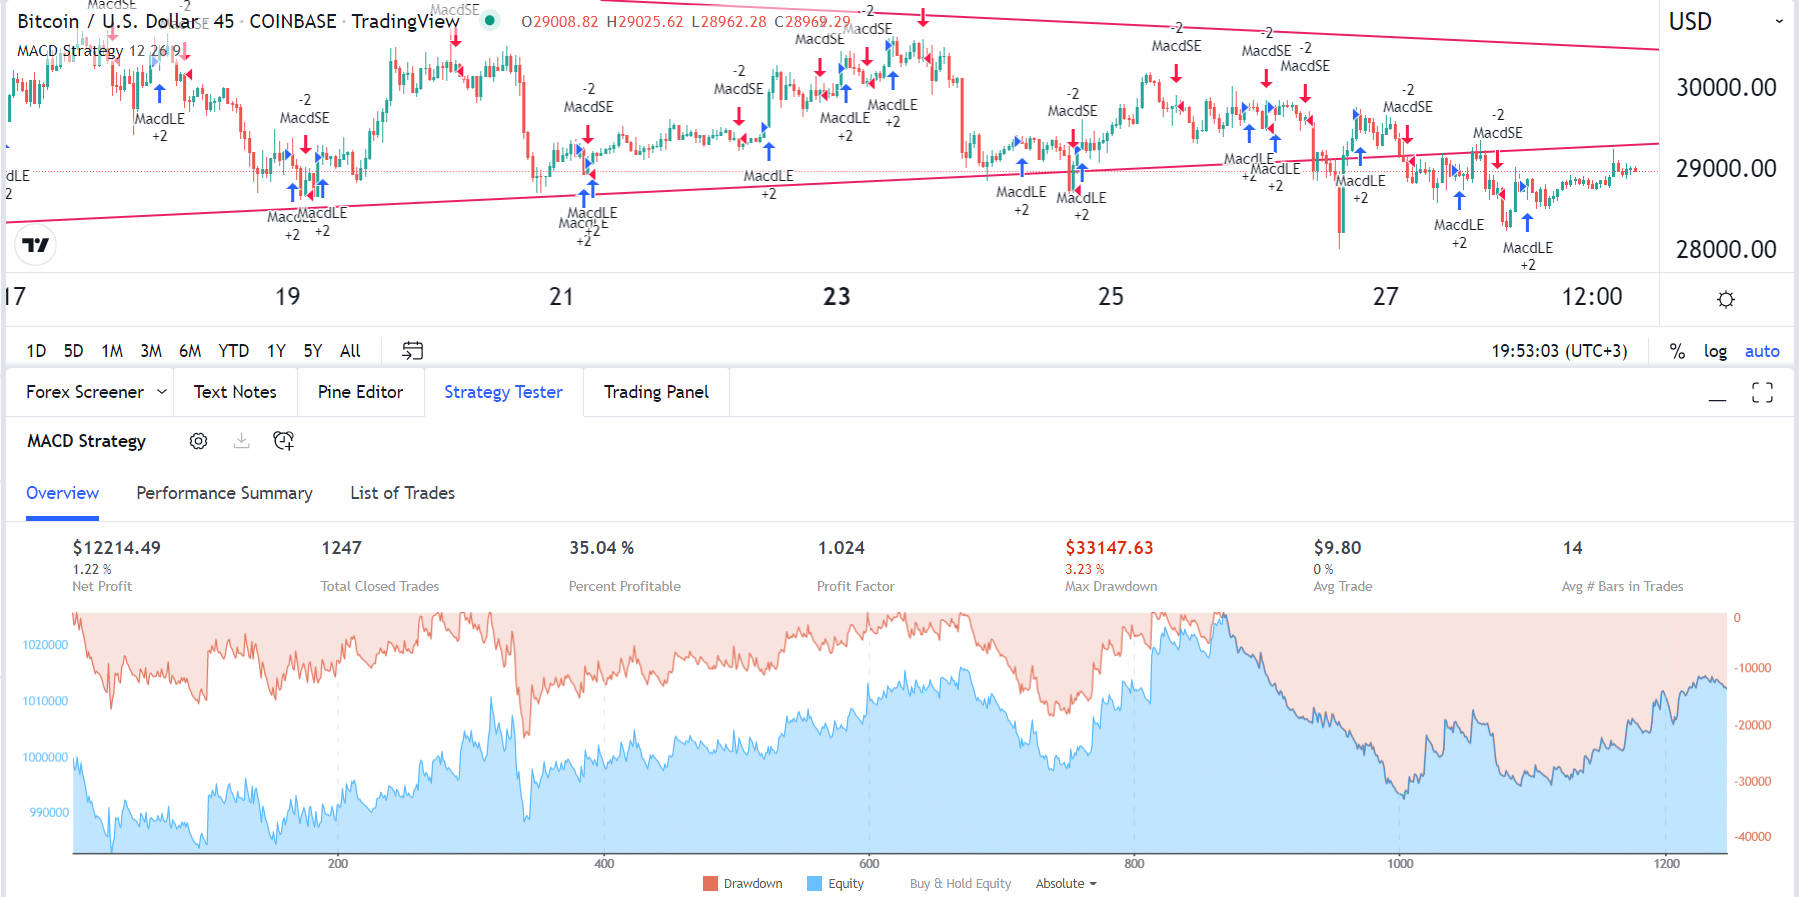
The MACD strategy in TradingView enters a buy trade when the histogram moves from negative to positive. The default value for the fast MACD is 12, while the slow line is 26. Also, the default value for the strategy’s length is 9. The chart above shows the performance.
RSI strategy
The Relative Strength Index (RSI) is one of the most popular technical indicators around. It is an oscillator that is used to measure the speed of change in assets’ prices. In most cases, traders use it to identify overbought and oversold levels.
An overbought level is where the asset is believed to be extremely overvalued, while an oversold point is where it is undervalued. As a result, one approach is to buy when it moves to the oversold level and sell when it moves to the overbought level.
This is the approach that has been adopted by the RSI strategy in TradingView’s platform. When activated, it will execute a buy trade when it moves below 30 and a short trade when it rises above 70. In most cases, however, many traders tweak these levels to meet their trading criteria.
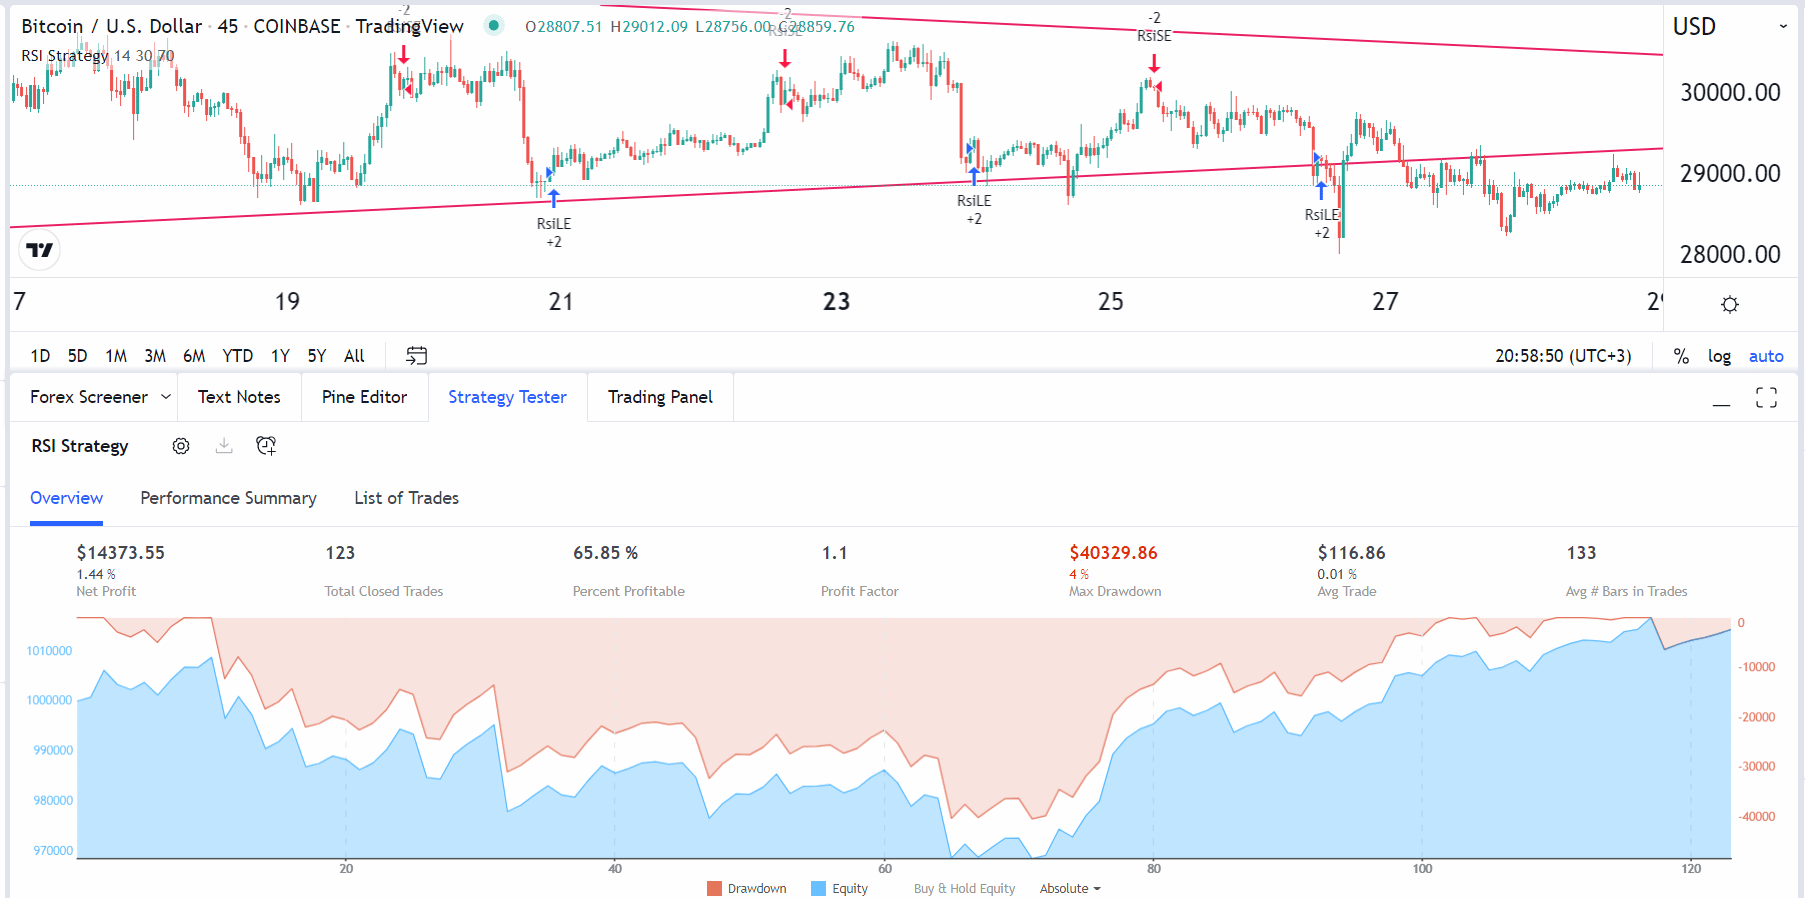
For example, one can place the oversold level at 20 and the overbought point at 80. The chart above shows the winning ratio of the strategy.
Channel Breakout Strategy
A channel happens when an asset’s price is moving between important support and resistance level. For example, if Bitcoin is moving between $40,000 and $42,000 for a while, then this is a channel.
There are several approaches to trading a channel in the market. First, you could decide to ride the channel by buying whenever it moves to the support and short when it moves to the resistance. Second, you could wait for a bullish or bearish breakout and ride the new trend.
The channel breakout strategy works by creating bands based on the highest and lowest values for the last X bars. As a result, it will execute a long trade when the high of the current bar is higher than the upper channel band of the previous bar.
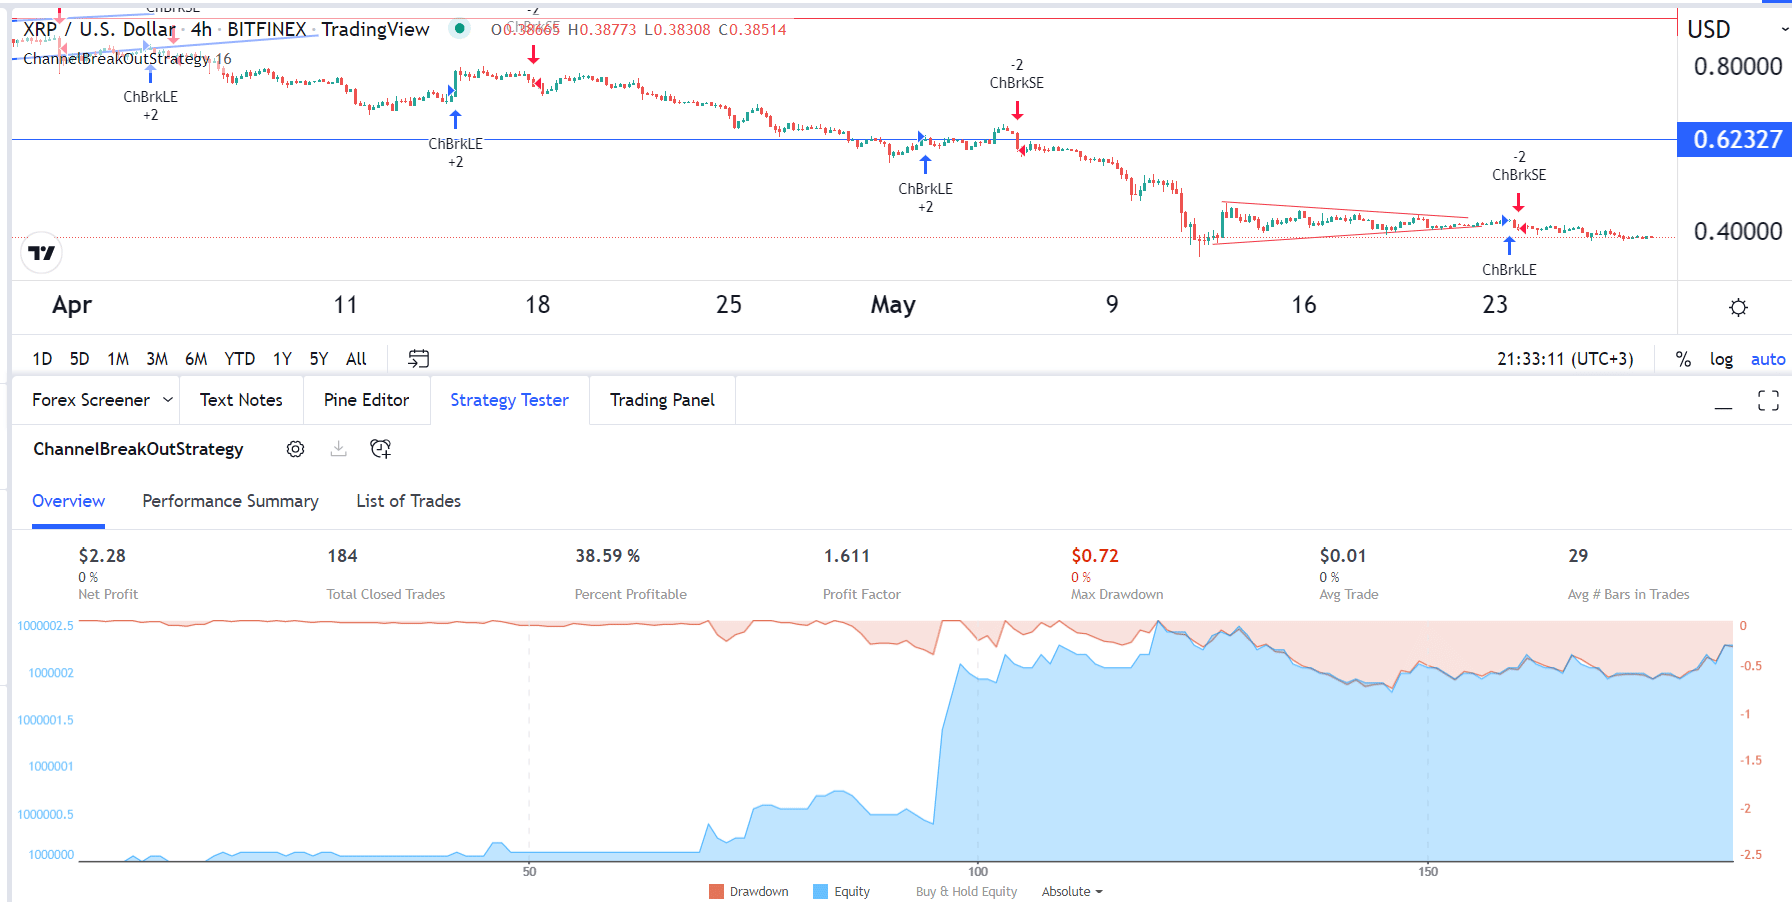
On the other hand, it executes a short trade when the current bar is below the channel band of the previous bar. The chart above shows the robot’s performance on the XRP coin.
Momentum
Momentum is one of the most popular trading approaches around. It allows traders to buy financial assets and hold them as long as the bullish trend is going on. Traders can sell short and hold the asset as long as the bearish momentum continues.
The momentum strategy works to achieve this. The trader first sets the period of study and then executes a long trade when the change over the last period turns positive. As the name suggests, this bot works well in periods when there is a bullish or bearish trend.
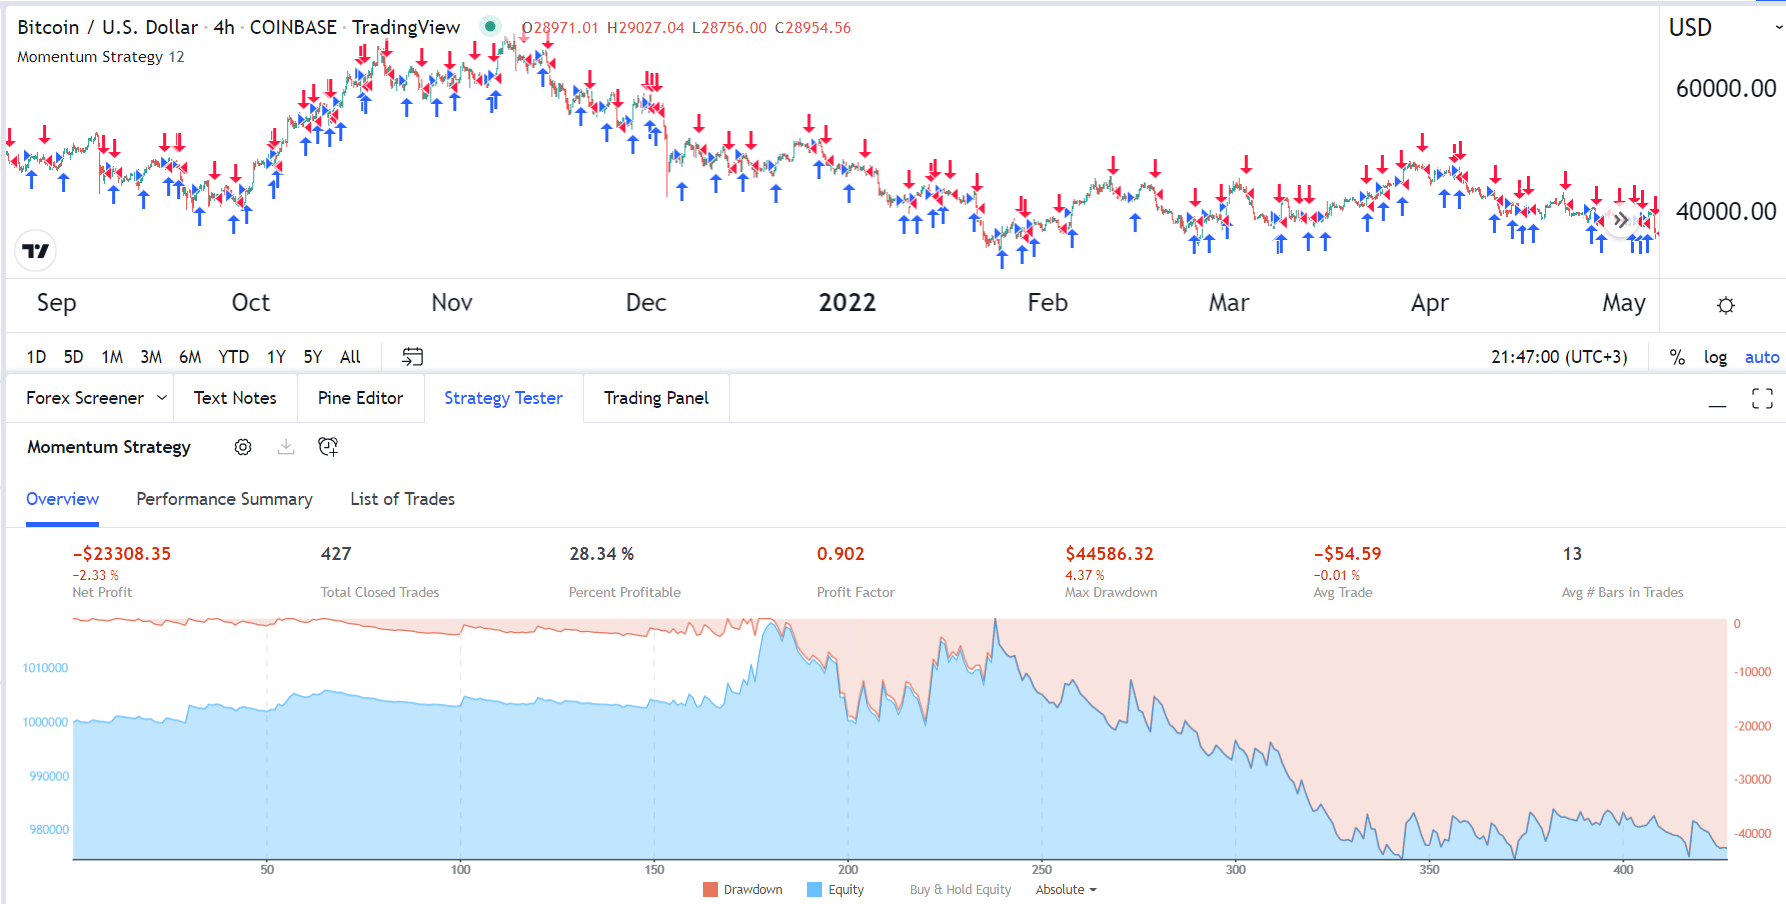
This explains why the percentage of profitable trades in the chart above has been 25%. In the chart, we see that Bitcoin was in consolidation mode.
MovingAvg2Line Cross
Moving Average is one of the most useful technical indicators. It is so important that most of the other indicators are built using its concepts. There are several approaches to using the Moving Average.
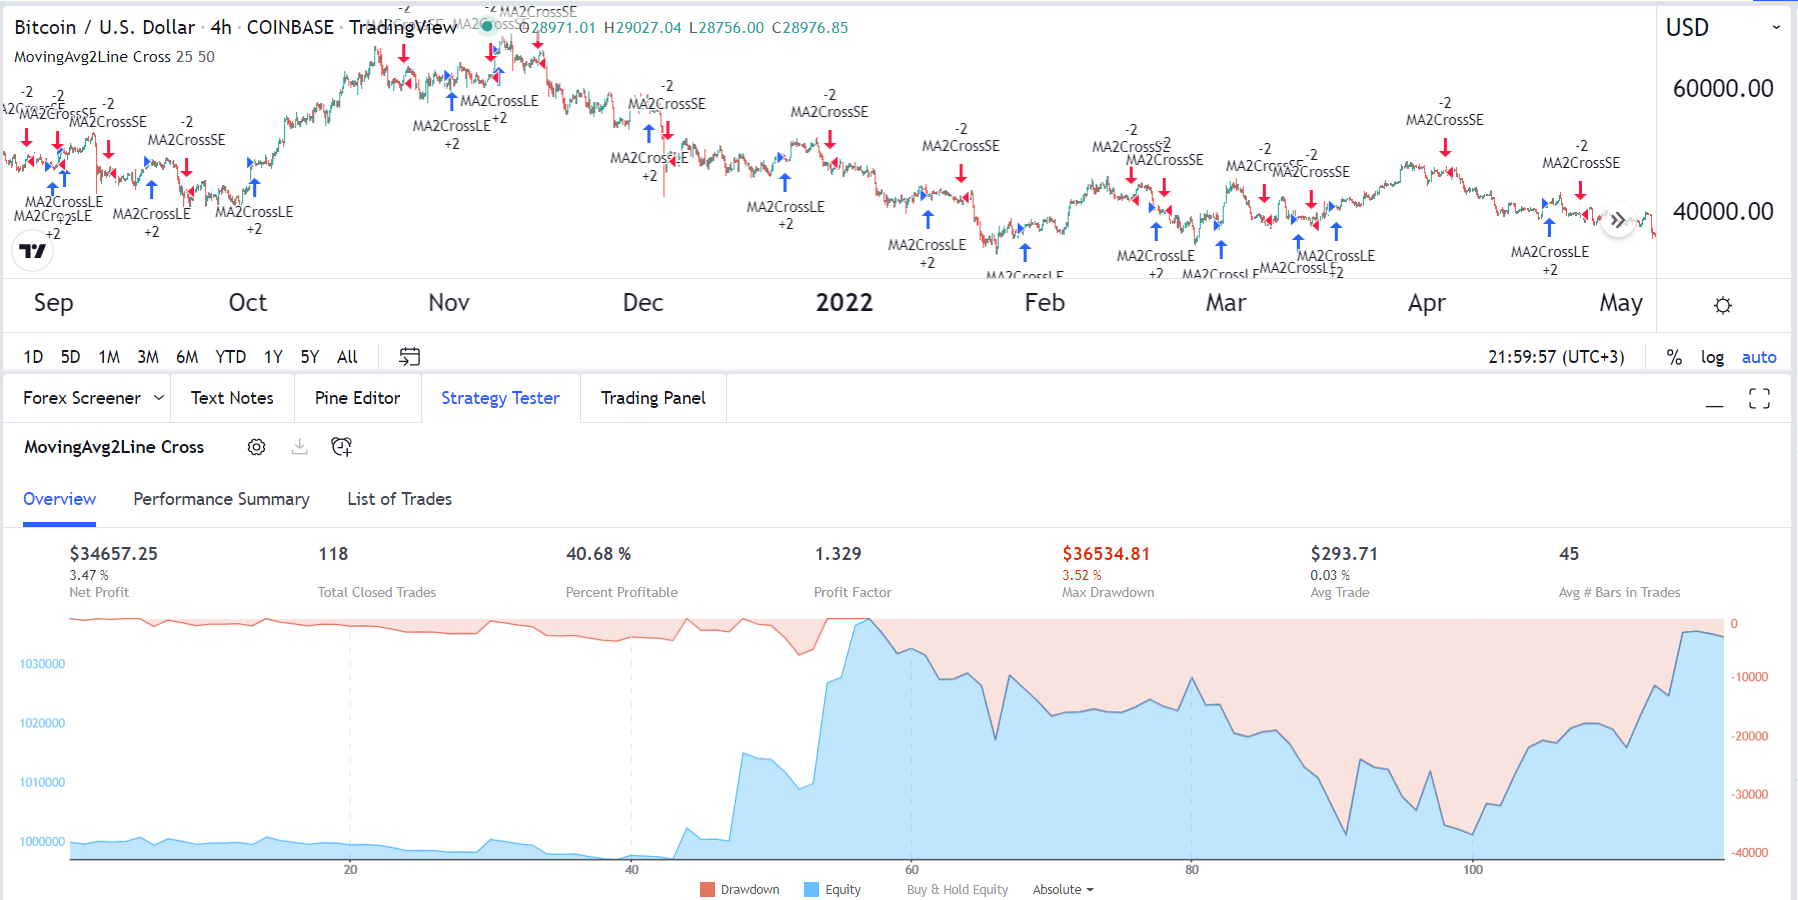
One of the essential ways is to use a fast and slow MA and see where they make a crossover. A bullish signal is triggered when the two lines make a crossover below the price. On the other hand, a bearish trade happens when it happens above the price.
This is the approach used by the MovingAvg2Line Cross. The default fast line is 8, while the slow line is 18. However, one can easily tweak these levels to meet their trading objectives. Like most strategies, it does not work well in a ranging market.
Summary
TradingView is one of the most helpful trading platforms worldwide. It has many features, such as technical indicators, trading scripts, and watchlists. Most importantly, it helps traders have access to thousands of financial assets. In this article, we have looked at some of the most effective TradingView strategies to use.