Moving Averages are the most basic and commonly used indicators in technical analysis. The indicator allows traders to know whether cryptocurrencies or currency pairs are trending up or down. The tool relies on the average price at different levels to ascertain the trend. However, it does not provide signals on the ideal entry and exit points. The Volume Weighted Average Price addresses this shortfall.
Understanding Volume-Weighted Average Price
It is a technical analysis tool that provides the average price of a currency or cryptocurrency over an average period while factoring in the number of items being sold at the given time. Unlike Moving Averages, it factors in volume, which is crucial to know what market participants are doing.
Traders commonly use it to weigh the price against the prevailing volume. Therefore, it makes it easy to know whether the market is overbought or oversold. As a result, timing trades becomes much easier while day trading.
The indicator finds solid use among traders with large orders as it allows them to know the average price in the market and the ideal trade to enter at the given time. For instance, if the prevailing price is below the VWAP line, a trader may use the opportunity to enter a long position as the prospect of price rising to the average price according to VWAP is high.
Likewise, a trader may look to enter a short position if the price is above VWAP. According to the indicator, the prospect of price tanking back to the average price is usually high. Thus short positions tend to get filled much faster during such conditions.
How it works
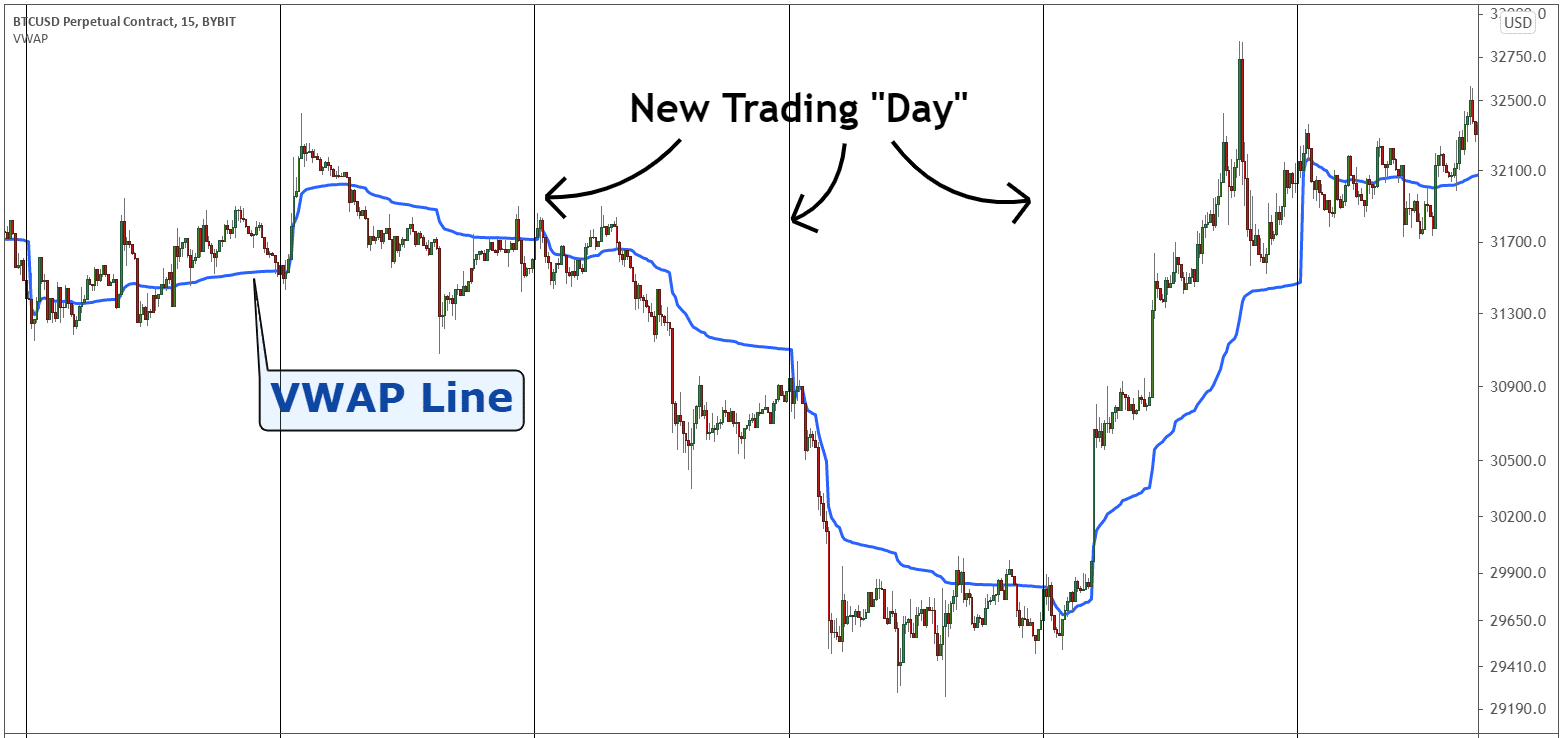
The VWAP indicator resets every day, therefore, generating a new average price. In the chart below, the vertical line shows the start of a new trading day on the Bitcoin chart. The blue line, on the other hand, is the VWAP line.

In a 15-minute chart, the VWAP line would be calculated by multiplying the prevailing price and the volume resulting in a subtotal.
Time subtotal = Price x Volume
The volume, in this case, will be the volume generated during the 15 minutes. After every 15 minutes, the subtotal would be added to the subtotal of the trading data resulting in a cumulative value (TP*V)
Finally:
VWAP= Cumulative (TP*V)/ Cumulative Volume
However, you don’t have to do all these computations as the charting software does everything and ends up plotting the VWAP line on the price chart.
Identifying overbought and oversold conditions
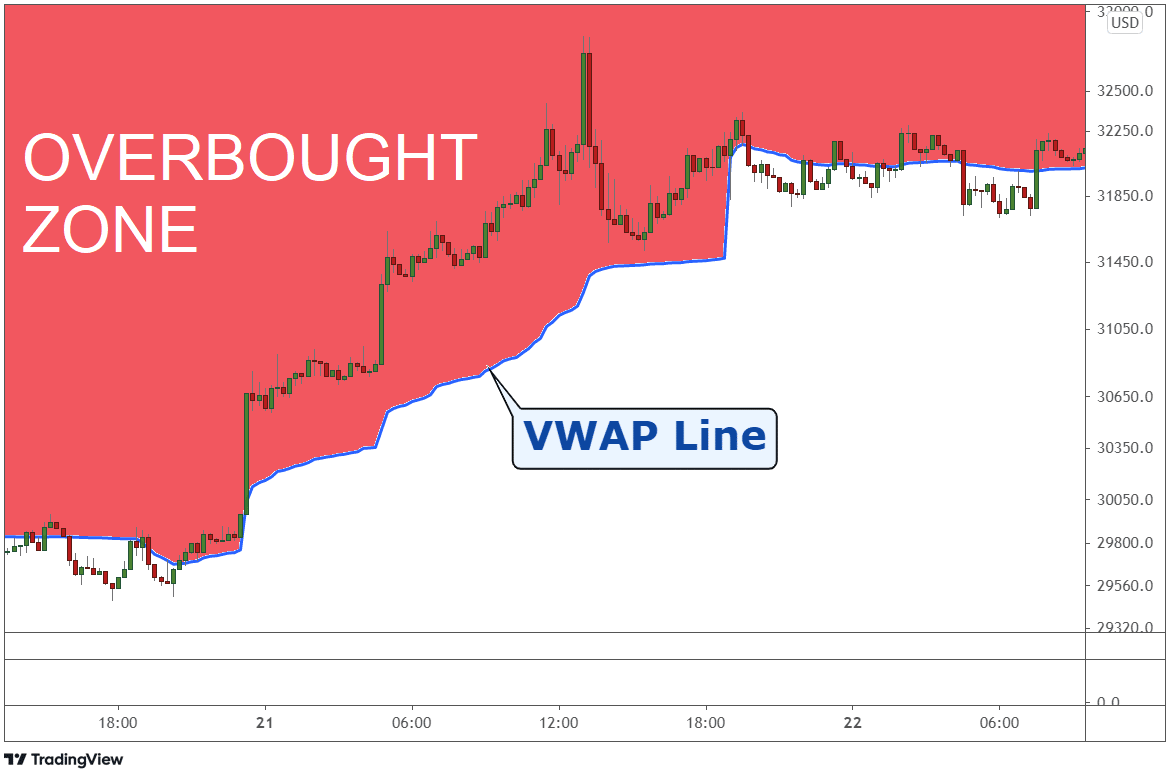
When plotted in the price chart, the VWAP line provides valuable insight into whether the currency or cryptocurrency is overbought or oversold. For instance, the underlying assets are considered overbought whenever the price is way above the VWAP line.

While the prospects of price moving further away from the VWAP line are high, it is never a good idea to buy at this level. Buying at this level would amount to buying high and paying more than the average price. In addition, the prospect of incurring significant losses on price reversing is usually high.
If the price is way below the VWAP line, it means oversold conditions implying the underlying asset has been sold significantly. While the prospect of price edging lower is usually high at these levels, selling at this level could be catastrophic as bulls tend to enter long positions to try and profit from price bounce back.
Trading Strategy 1
Retracement strategy
The strategy seeks to take advantage of short-term corrections in the market. For instance, if a cryptocurrency or forex pair is in an uptrend, the price tends to be above the VWAP line. However, pullbacks occur once in a while, resulting in lower price edging.

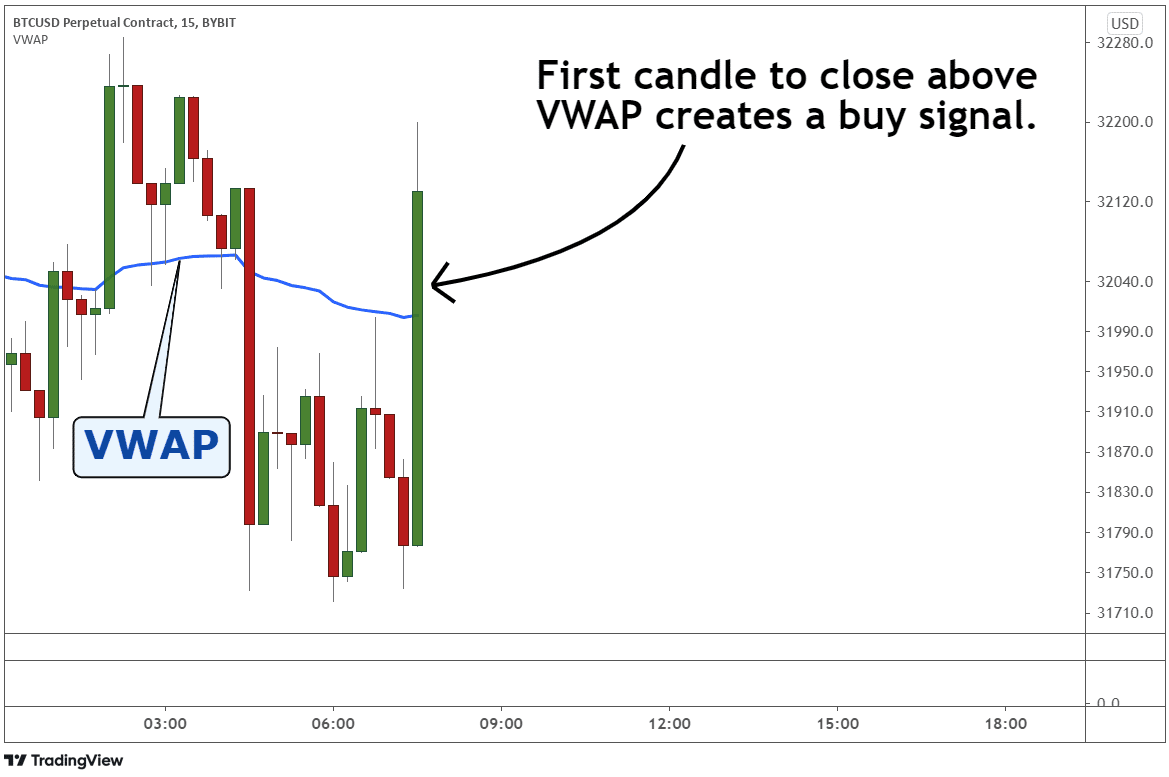
Once the price corrects and closes below the VWAP line, it is important to wait for potential bouncebacks. This would be the perfect time to eye long positions as more buyers would often enter the market and buy as soon as the price closes below the VWAP line, only to start moving up.
Similarly, if the cryptocurrency is in a downtrend, the price would often be below the VWAP line. Once a bounce-back occurs and the price moves and closes above the VWAP line, it would be wise to eye short positions as the prospect of price edging lower afterward in continuation of the long-term downtrend is usually high.
Trading Strategy 2
Using bands and channels
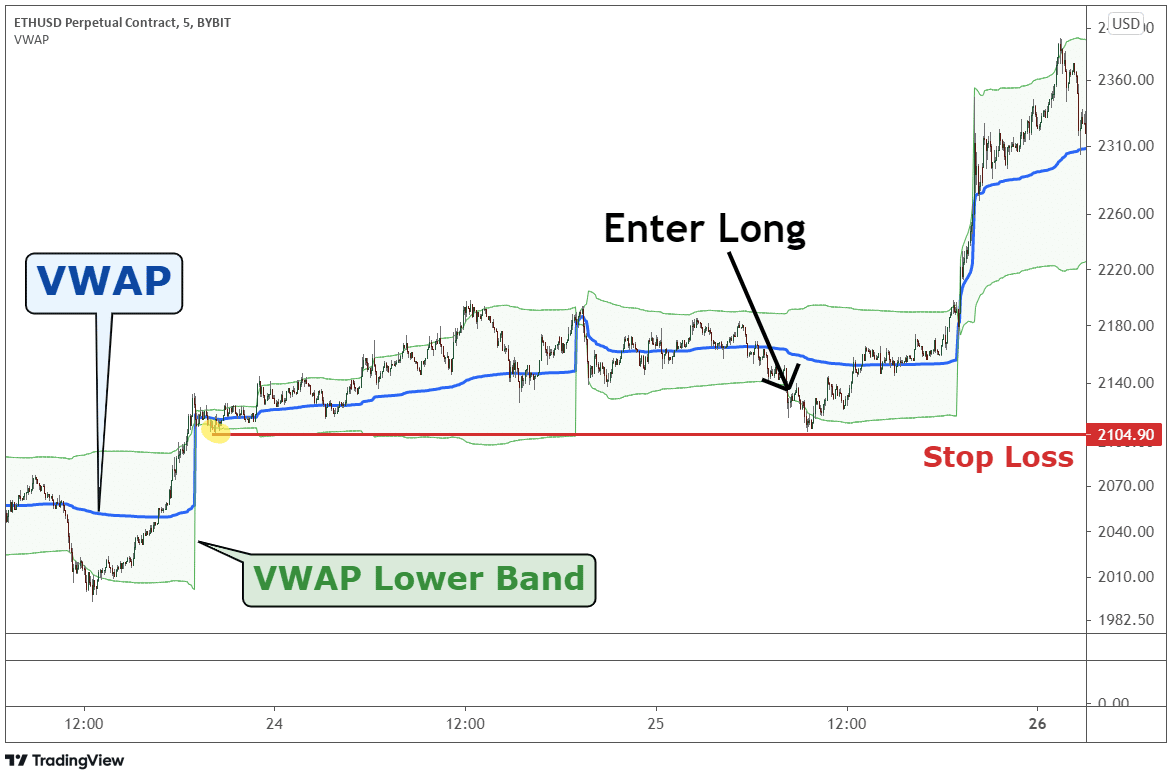
The strategy entails activating bands around the VWAP tool and setting the band to two standard deviations. This will result in the addition of an upper and lower band with the VWAP line in the middle.

As was the case with the previous strategy, it is important to ascertain the prevailing market trend. If the market is in an uptrend, then the best trades likely to have the desired outcome will belong. Conversely, whenever the price is above the VWAP line and moving towards the upper band, it is important to be cautious.
Once it starts correcting and moving lower, wait for it to move below the VWAP line. Once it moves lower and tries to penetrate the lower band, wait for a signal in the form of a bullish candlestick to enter a long position. Once the price returns above the band, enter a long position to ride the uptrend.
The stop loss can be placed a few pips below the lowest price at the point it penetrated the lower band. The take profit, on the other hand, can be twice the distance from the entry to the stop loss.
Bottom line
Volume Weighted Average Price is one of the best indicators for traders looking to get reliable buy and sell signals while trading volatile assets such as cryptocurrencies and forex. While the tool can be used with longer time chart frames, it was ideally developed for short-term traders as the average price resets every day. Therefore it is an ideal technical indicator for day trading.
Additionally, the indicator should never be used in isolation but with other indicators for the best outcomes. For instance, it can be used with Moving averages to ascertain the prevailing market trend to know whether to enter long or short positions.