Most beginners and experienced traders know the indicator as Bollinger Bands. This is a fairly old and reliable tool. In this article we will consider all the nuances of using such indicators and the advisability of trading on various timeframes. You can use strategies for your own trading or adjust it to your trading experience.
What is Bollinger Bands
Bollinger Bands is a useful technical indicator (more precisely, an overlay) that displays the relative value of an instrument based on volatility (the range and speed of price changes). The indicator is superimposed directly on the chart, and consists of three lines or stripes:
- center: moving average (MA)
- top: top bar = MA + 2 standard deviations
- bottom: bottom bar = MA – 2 standard deviations
Standard Deviation is a term from descriptive statistics that measures the spread or variance of a sample (see a separate article about standard deviation). A good example: there are two samples: 1, 3, 5 and 2, 3, 4. The arithmetic mean of both samples will be the same, i.e. 3. But the range, spread, or variance of these samples is different: the first sample has 2, and the second one has 1.
The most important question for the correct construction of Bollinger Bands is the choice of the period of the moving average n. As a rule, a period of 20 is taken, but this is only a recommendation.
Each case and currency is unique and requires a special approach. To choose the right period for the Bollinger Bands, you need to observe how the price will behave relative to the lower band with a double bottom: the second bottom should remain within the corridor. If the second bottom is outside the lower band, then the period is too short.
History of Bollinger Bands
In the 1980s, John Bollinger developed a new technical indicator that substantially complemented technical analysis worldwide. Despite the fact that prior to the invention of the Bollinger Bands, there were indicators and overlays that can accurately identify the moments of revaluation and underestimation, Bollinger Bands have become one of the leading technical indicators, and should be in service with any technical analyst.
How Bollinger Bands can be adjusted, and how is it useful for traders
Today, this indicator is present on most trading platforms. Users should select this indicator and use a ready-made template or configure everything manually. You can also use MetaTrader and advanced settings which will automate trading thanks to a forex robot and an adviser. In general, you can apply this strategy to day trading on the market.
It’s also applicable with various currency pairs. It’s best to use the classic options with the strongest currency variations. It will allow you to get more entry points throughout the day. It is also worth refraining from using small time frames. This can lead to more trading signals of bad quality. It is better to use an interval from 30 minutes to several hours. It will reduce the number of signals to improve their quality.
Basic strategies, using Bollinger Bands
Bollinger Bands – a very useful technical indicator that allows you to easily identify the periods when the price of a financial instrument is lower or higher than fair value. Bollinger Bands use volatility, standard deviation and moving averages, which makes them not very convenient for one-handed calculation without equipment.
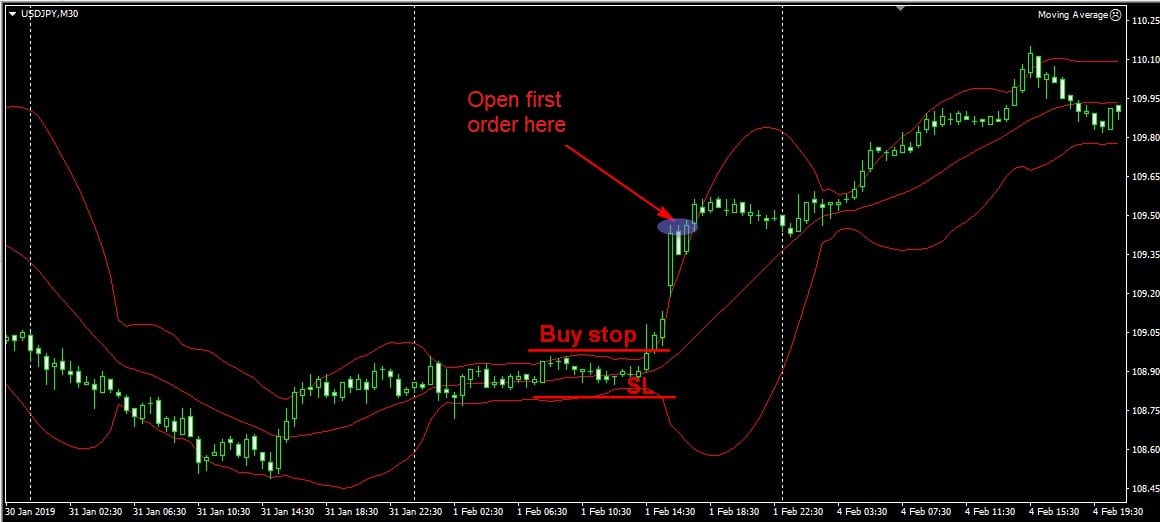
Pending orders must be placed at the borders of the Bollinger Channel. After the operation of one, the second should be deleted. Stop loss is the opposite border of the corridor. It is recommended to enter the market with two orders. The first one can be closed at the end of the impulse when the market calms down. For the second, it is appropriate to use a trailing stop to maximize profits from trading.

Bollinger Bands Indicator + Stochastic Divergence
Trading strategies for Bollinger, where the indicator is used in the singular, give a lot of false signals. Systems with two or three components are more reliable.
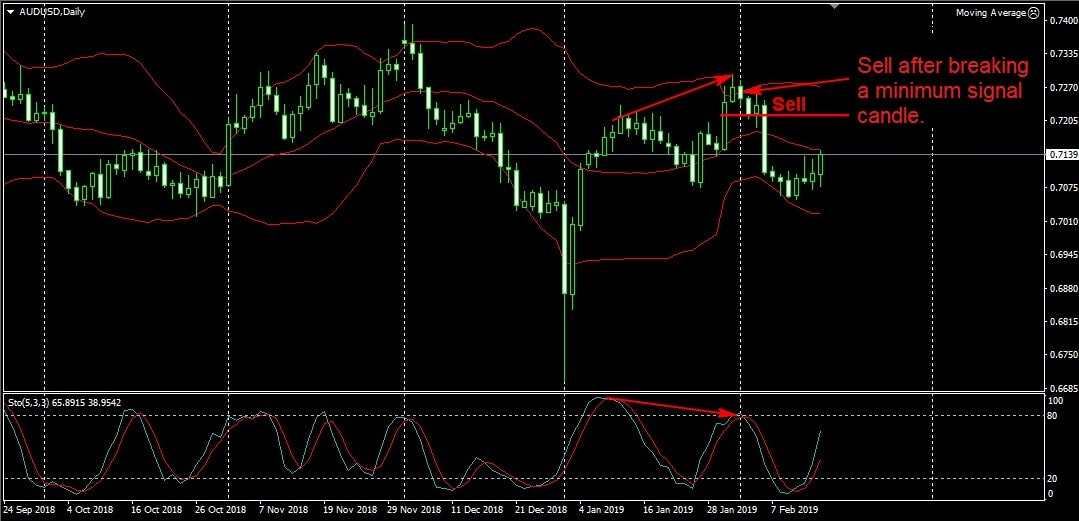
In addition to the Bollinger Wave indicator, the strategy involves the use of Stochastic with standard parameters. To find the entry point to the market, it is necessary that the price go beyond the upper or lower boundaries of the Bollinger channel. If the Stochastic Oscillator is showing divergence at this time, you can open a trade.
You can sell a pair after the price crosses the top line of the Bollinger indicator from top to bottom. To enter the market with a long position follows after the price returns inside the corridor and the formation of the first rising candle above its lower border.

The most effective strategy is working on a daily timeframe. Use of the H4 period is also permitted. It is not necessary to go even lower, since the number of signals increases on the M5-H1 timeframes and their accuracy decreases.
Stop-loss is placed above the nearest local extremum, behind the boundary line of the Bollinger channel. The price target is the opposite end of the range. The probability of its achievement is greater on the D1 timeframe.
Scalping with Bollinger Bands
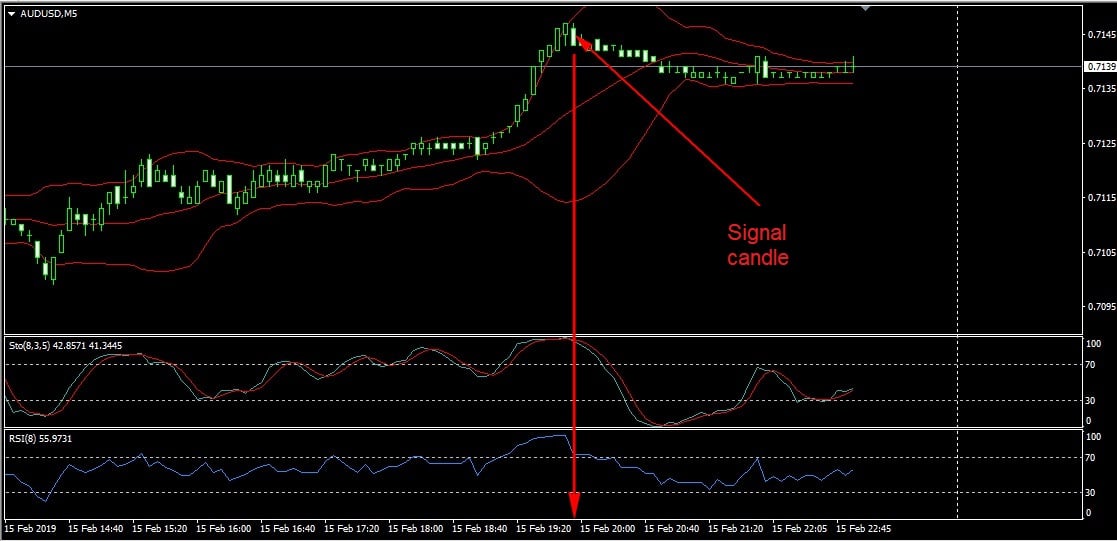
In the scalping strategy for Bollinger, three indicators are used: directly Bollinger Bands for entering the market, Stochastic with parameters 8, 3, 5 and RSI with a period of 8 for filtering signals. Working timeframe is M5. Currency pair doesn’t matter.
A signal to sell a currency pair appears when the price goes beyond the Bollinger channel (crosses its upper line) and again returns inside the range. The Stochastic and RSI indicators at this time are above level 70 (in the overbought zone) and are directed downwards or are going to cross it from top to bottom. A signal candle is considered to be one that is closed inside the Bollinger channel.

The opposite rule applies to opening buy orders. The price should cross the lower boundary of the Bollinger channel from top to bottom, and then return to the inside of the range. The Stochastic and RSI indicators at this moment exit the oversold zone or are inside of it (below level 30). As soon as the first candlestick closes above the lower line of the Bollinger Bands indicator, you can buy a currency pair.
Stop-loss must be set 5-7 points above the local extremum, which was formed at one of the borders of the range. Take profit is 10-12 points. If you trade at night, close trades when the price reaches 5 profit points. During this period, the market is not too active and liquid. Very often the price fluctuates in a narrow corridor with a width of only 5-10 points.

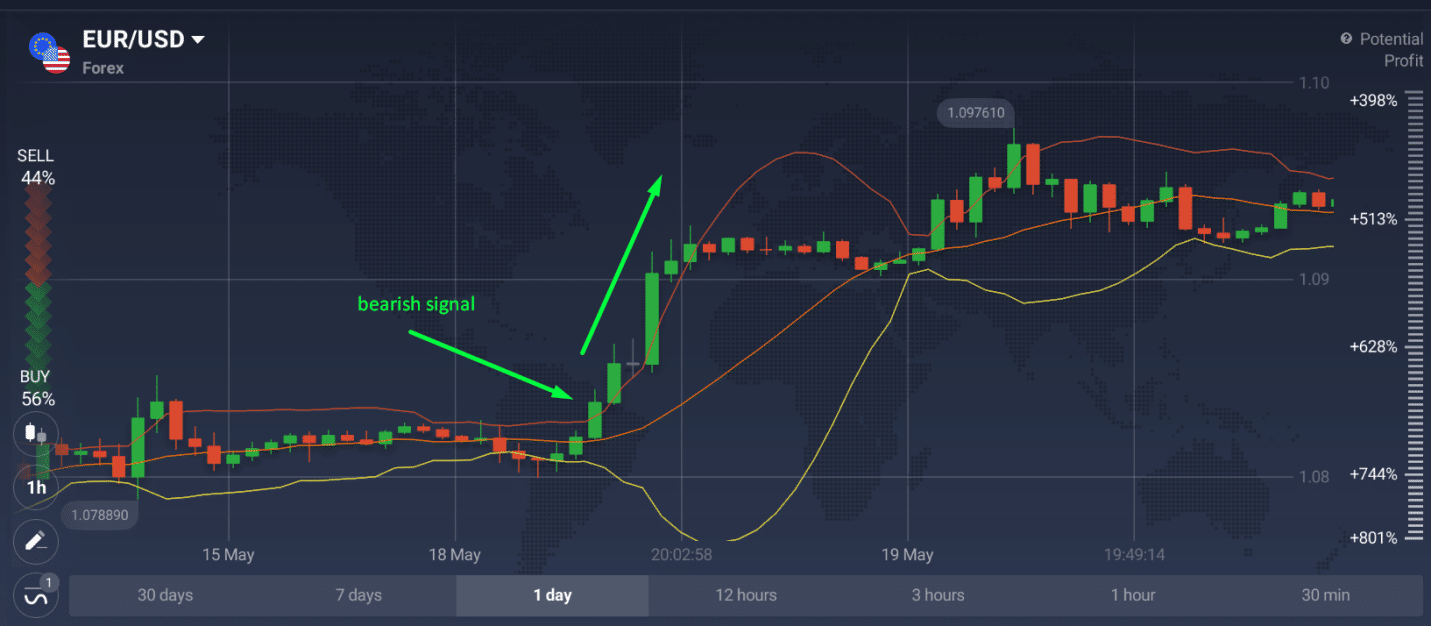
The last example is the classic option of breaking through the lacrimal canal when we see a clear trend with an upward movement. The price was in lateral movement long enough and now there is a significant spike. As soon as the third green candle breaks the top of the channel you need to buy. As you can see, this is a fairly clear signal that marked a long bullish movement.
Final Words
Bollinger Bands is a fairly indicator that is based on moving averages. When used correctly, this can become the basis for a successful strategy for beginners and experienced traders. First of all, you need to understand your movements and correctly calculate all the characteristics depending on the timeframe. In this case, you can get clear entry point signals. But it’s important to follow your strategy and analyze historical charts to minimize the risks.