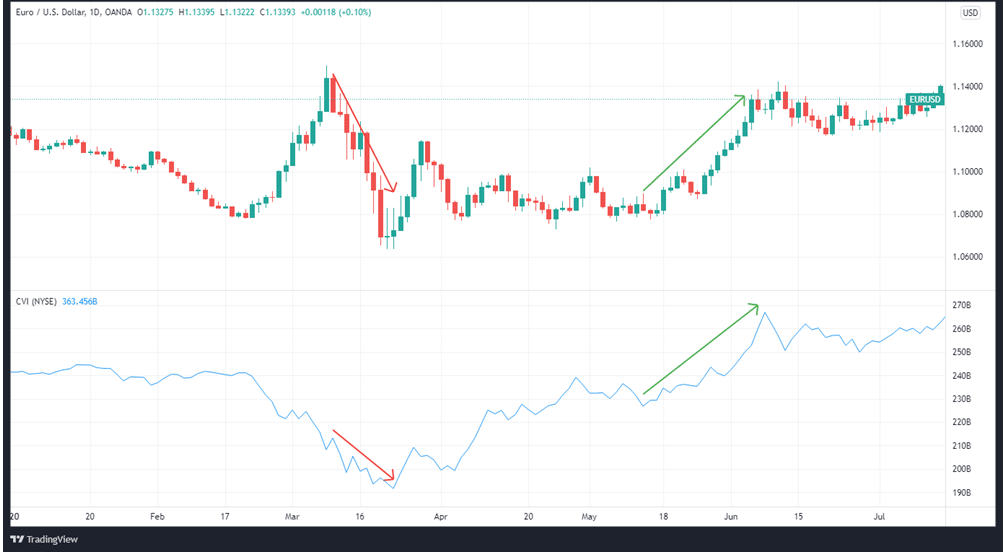
The cumulative volume index (CVI) is an index that calculates the flow of capital into and out of the stock market by aggregating the difference between the predicted asset price and the present asset price. CVI is comparable to On Balance Volume (OBV), but instead of assuming all volume is up or down when the market closes higher or lower, CVI uses real up- and down-volume.
The trend is the most important aspect of the CVI for analysts and traders. The CVI value is lower when more assets are decreasing than are advancing, which indicates that a market is losing momentum. The higher the CVI value, the more assets rise, which indicates that market action is strengthening.
When CVI rises, the market is bullish; when it falls, it is bearish. Traders can recognize divergences that could indicate a reversal. You can use the indicator together with other relevant tools to strengthen the accuracy of your analysis by confirming the CVI trend.
With this type of knowledge at hand, traders and investors can then take appropriate positions in the market. In essence, it helps in faster decision-making as to whether to go long or short on a particular asset, based on the potential changes in the market strength.
How does it work?
By subtracting the volume of declining stocks from the volume of increasing assets and adding the result to a continuing total figure, the CVI demonstrates how money moves in and out of the market. The best way to interpret the CVI is to keep an eye on the overall patterns. The CVI shows whether there has been more down-volume or up-volume, as well as how long the current volume trend has lasted in the market.
Cumulative Volume Index values are higher when the volume of rising stocks is greater than that of decreasing ones. This means that more money is coming into the market. The lower the CVI value, the smaller the volume associated with dropping equities as compared to the volume associated with advancing stocks. This means that more money is going out of the market.
The combination is crucial with this signal, as it is with other indicators, and traders need not hesitate to use it alongside other technical indicators or research tools. CVI, when paired with other indicators, can be used to spot patterns and boost the likelihood of profitable trades. The tool has a significant impact on assessing whether capital is a point of entry or exit. CVI patterns affect traders’ perceptions in the market, but only to a certain extent.
The CVI is insufficiently detailed to provide clear trading or investing tip. Rather, it is a comprehensive market instrument for determining breadth.
The CVI aids in determining if market capital is flowing into or out of an index. Many people believe that a trend has a weakening momentum if the CVI goes lower. This is generally interpreted as an indication that the trend may be about to reverse. In contrast, a rise in the CVI may indicate that a trend is gaining traction. Trading in the direction of the current trend may be a good idea at this point.

When the CVI trend is low, traders may believe that momentum is weakening, indicating the possibility of a reversal. When the CVI trend is high, traders typically assume that momentum is increasing and that a reversal is unlikely. Thus it’s time to increase their investments. You can see an example of this in the chart above.
This gives the trader a chance to look for price convergence and divergence based on the CVI trend line. Because the CVI number does not reflect the highest and lowest points, it could be interpreted as an indication of a sure solution to a problem at that moment in time.
CVI can be interpreted by looking at its long-term trend. We can tell whether there has been a greater uptick in volume or a decrease in volume, as well as how long the present volume pattern has been in place.
Also, keep an eye out for divergences between the CVI and a market index. Is the market index, for example, establishing new highs while the CVI is failing to do so? If this is the case, the market is likely to correct, confirming the CVI’s underlying narrative.
CVI calculation
We obtain CVI by subtracting the volume of declining assets from the volume of assets that are rising in volume. We then add this difference to the cumulative total.
The following is how to compute the cumulative volume index:
CVI=PPCVI+(Advancing assets−Declining assets)
Where:
PPCVI=Previous Period’s CVI
Advancing assets = The number of assets that are currently advancing.
Declining assets = The number of assets that are currently depreciating.
In summary
The CVI is a popular market breadth indicator that traders can use to figure out whether money is flowing into or out of the market. It is possible to spot a trend using this data. Instead of employing CVI as a single indicator, many traders and investors combine it with other types of market indicators. By doing that, they improve their chances of making a profitable transaction by keeping an eye out for signs of trend confirmation and trend reversal.