The Average Directional Index, abbreviated by ADX is a technical indicator that is effective to determine and measure the overall strength of a trend. It computes the average of the expanding range values.
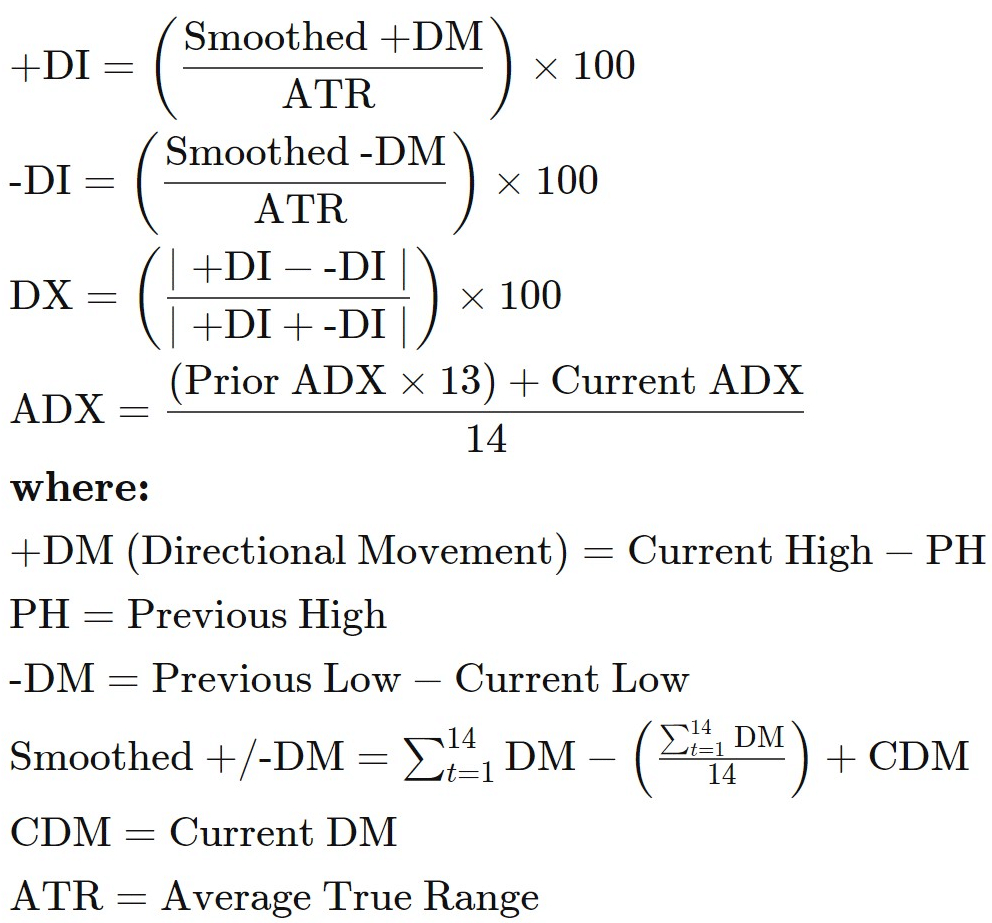
Fig.141 Average Directional Index (ADX) formula
According to the Average Directional Index formula (Fig.141), the indicator has three lines -DI, +DI, and ADX. The negative directional indicator noted as -DI, and the positive directional indicator noted as +DI are signaling the direction of the momentum. The ADX defines the strength of the trend. Combining the three lines, the indicator helps traders to assess the intensity of the trend with ADX, whilst -DI and +DI confirm the direction of the price movement.
The ADX distinguishes a strong trend when the ADX is above the 25-level and a weak trend when it crosses below 20. Crossovers of the -DI and +DI lines are useful indications and can signal to buy and sell. For instance, a buy signal might be the +DI line crosses above the -DI line with the ADX above the 20-level. Conversely, if the -DI crosses above the +DI, with the ADX the 20-level, it may indicate a potential sell signal.
Crosses can also be used to define a trades exit strategy. For instance, for a long position, the exit may be performed when the -DI crosses above the +DI. Note that, when the ADX line is below the 20-level, the indicator is indicating weak momentum and that it may suggest that it is not an optimal timing to enter trades.
In this guide, we will go through how to detect a buy and a sell signal with the Average Directional Index and demonstrate how to store the indicator data points and retrieve the data for further use. MQL4 ADX function retrieves the indicator’s data point, contrasting with MQL5, which requires the data to be saved first in the local buffer and in a declared “double type” array. It may seem puzzling, but it is not. We will describe step by step this MQL5 feature. And finally, we will demonstrate a practical example of usage.
How does the indicator signal work for the Average Directional Index?
Before we go through the details of the Average Directional Index code, let us describe the buy and sell signals interpretation. The indicator consists of three lines -DI, +DI, and ADX. The movement of the ADX line represents the strength of the momentum, while -DI and +DI define the direction of the trend.
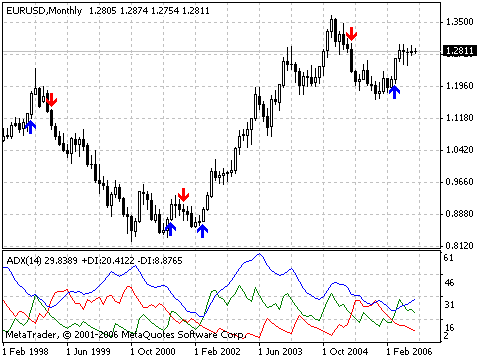
Fig. 142 Average Directional Index signals on the chart
Buy signal
A buy signal can be confirmed by the cross of the +DI line (green) over the -DI line (red). The ADX line indicates the strength of the signal and is represented with the blue line (Fig.142).
Sell signal
Conversely, a sell signal can be identified by the cross of the green -DI line over the red +DI line.
ADX line: momentum strength
It is recommended to trade in a strong trend which is specified by the blue ADX line. A potential signal with sufficient momentum is above the 20-level.
How the Average Directional Index stores its data points
The Average Directional Index saves its data point in a dynamic array in the indicator buffer. The size of the array is automatically allocated by MetaTrader at its initialization. An indicator buffer is a time-series array, thus has the distinctive feature of reverse indexing. It implies that the array is sorted by descending where the latest data point is on the left side of the array. Time-series is utilized to store historical data and comprise the time information.
Hence, the time-series element with index zero contains the latest quote of a symbol. For instance, an indicator on the daily timeframe will have the current price at index zero and yesterday’s data at the position index one.
Note that the Average Directional Index is composed of three lines, ADX, -DI, and +DI. Each line will be stored in three separated buffers. This particularity applies only to MQL5, and three “double type” arrays are required to be declared to store each distinctive data point. The index zero of the iADX function contains the ADX line, the index one +DI, and the index two -DI data points (Fig.143).

Fig.143 Indicator data points array
MQL5
To access the Average Directional Index data, MQL5 requires the CopyBuffer() function. This approach does not relate to MQL4 as the iADX() function in MQL4 directly returns the value of the indicator data point instead of its handle. The following parameters should be specified:
- Provide the handle that is returned by the iADX() function
- Provide the buffer id:
- Zero: for the ADX line data points
- One: for the +DI line data points
- Two: for the -DI line data points
- Provide the start position where zero is the most recent data point. For instance, on a daily time-frame, zero is the current data point, and one is yesterday’s data point.
- Specify the number of data points to retrieve from the iADX() function.
- Provide variables where the data will be stored. ADX requires three variables to store each lines’ data points, ADX, +DI, and -DI.
How to retrieve Average Directional Index data with CopyBuffer() function?
- Declare a variable for the handle: int IndicatorHandle = iADX();
- Declare three variables to store each indicator’s line (ADX, +DI and -DI):
- double adx_adx;
- double adx_plus_di;
- double adsx_minus_di.
- Copy the data to the indicator variable and retrieve data points for each ADX line
- CopyBuffer(IndicatorHandle, 0, 0, 100, adx_adx);
- CopyBuffer(IndicatorHandle, 1, 0, 100, adx_plus_di);
- CopyBuffer(IndicatorHandle, 2, 0, 100, adx_minus_di);
- Retrieve Average Directional Index data point with:
- adx_adx[0], adx_adx[1]; for ADX line
- adx_plus_di[0], adx_plus_di[1]; for +DI line
- adx_minus_di[0], adx_minus_di[1]; for -DI line
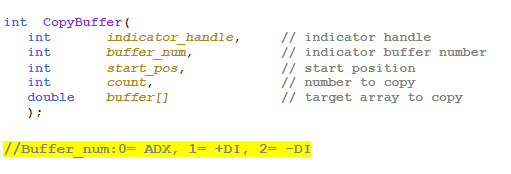
Fig.144 CopyBuffer() Function
How to access the indicator data?
MQL4
The iADX() function can return each of the three lines of data points:
- ADX line = MODE_MAIN
- +DI = MODE_PLUSDI
- -DI = MODE_MINUSDI
The iADX() function will return the data points value according to these six parameters:
- The symbol of the traded instrument. You may provide a string such as “EURUSD” or use the function Symbol() to retrieve the symbol from the chart where the Expert Advisor is attached to.
- Provide the time frame using the enumeration value from the constant ENUM_TIMEFRAMES, for instance:
- PERIOD_CURRENT, for the current timeframe from the chart,
- PERIOD_M1, for the one-minute timeframe,
- PERIOD_D1, for the daily timeframe.
- Provide the averaging period, for instance, 14 for the 14-period.
- Provide the applied price method using the ENUM_APPLIED_PRICE constant:
- PRICE_CLOSE: for the close price,
- PRICE_OPEN: for the open price,
- PRICE_HIGH: for the highest price within the defined averaging period,
- PRICE_LOW: for the lowest price within the defined averaging period,
- PRICE_MEDIAN: for the median price within the defined averaging period.
- Provide which indicator line to extract data points:
- MODE_MAIN for the main ADX line
- MODE_PLUSDI for +DI
- MODE_MINUSDI for -DI
- Provide the element index where zero is the latest data point, and one is the previous data point.
iADX() function will return the data point according to the supplied parameters.

Fig.145 MQL4 Average Directional index function
MQL5
When calling the iADX() function, the function will create the Accelerator Oscillator in the MetaTrader global cache and returns its handle according to these provided parameters:
- The symbol of the traded instrument. You may provide a string such as “EURUSD,” or you can use the function Symbol() to get the symbol from the chart where the Expert Advisor is attached to.
- Provide the time frame of the data point to extract using the enumeration value from the constant ENUM_TIMEFRAMES:
- PERIOD_CURRENT, to get data points from the current timeframe from the chart to which the Expert Advisor is attached to.
- PERIOD_M1, for the one-minute timeframe.
- PERIOD_D1, for the daily timeframe.
- Finally, provide the averaging period; for instance, the 14-period is the most commonly used averaging period.
Note that to retrieve data points from the iADX() function, you need to use it in combination with the function CopyBuffer(). As the Average Directional Index indicator comprises three lines, you may call CopyBuffer() three times for each line, ADX, +DI, and -DI:
- CopyBuffer(IndicatorHandle, 0, 0, 100, adx_adx);
- CopyBuffer(IndicatorHandle, 1, 0, 100, adx_plus_di);
- CopyBuffer(IndicatorHandle, 2, 0, 100, adx_minus_di).
The second parameter to provide to CopyBuffer() is the index where:
- One: is to retrieve the main ADX line,
- Two: for +DI line,
- Three: for -DI line.

Fig.146 MQL5 Average Directional index function
Practical case
MQL5
Fig.147 demonstrates the use of the Average Directional index to generate a simple signal comparing the previous +DI and -DI lines. Only signals with a strong trend are considered with the main filter ADX above the 20-level.
Line 121: Declare the indicator handle and assign the value of the iADX() function handle.
Line 122 – 124: Declare variables that will store data points for each respective ADX line.
Line 126 – 128: Collect and save data points to each respective array. Note the second parameters, 0, 1, 2. These numbers are the index of the buffer that contains the main ADX line, +DI, and -DI lines.
Line 130 – 145: Filter out and consider the only signal that is strong with the main ADX line above the 20-level. Check for any crossover for buy and sell signals.
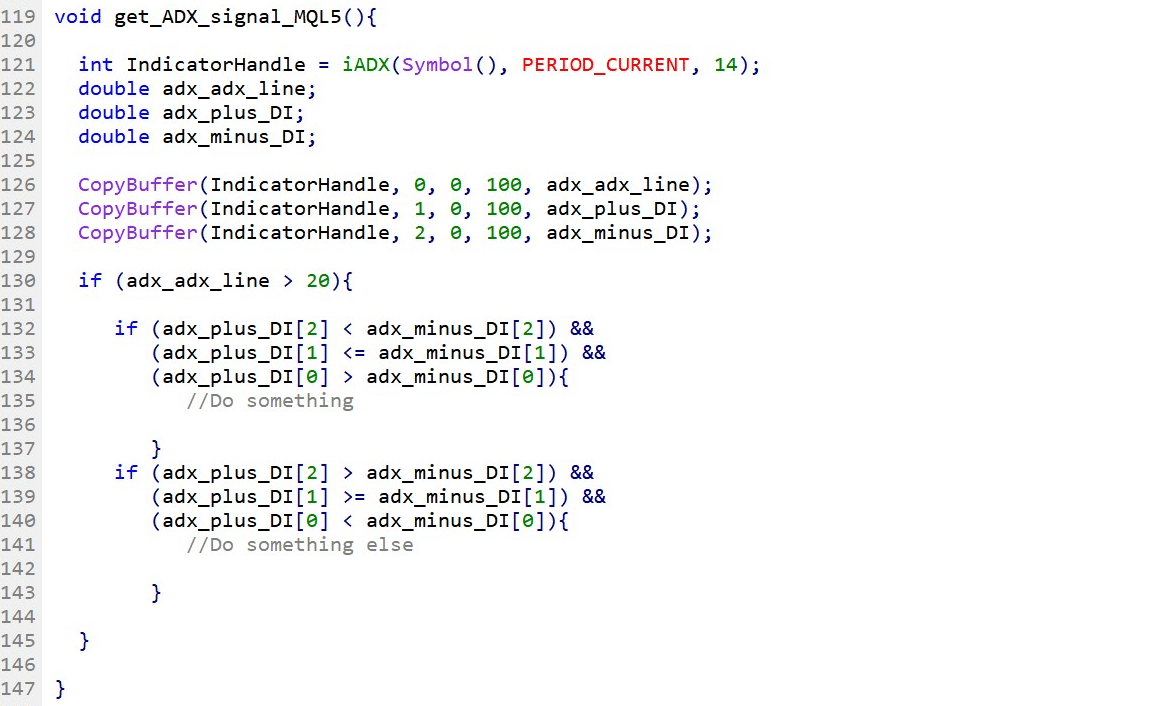
Fig.147 Check for +DI and -DI crossover and ADX strength in MQL5
MQL4
Fig.148 shows how to implement the Average Directional index to produce a simple signal comparing the previous +DI and -DI lines. Only if the main ADX line is above the 20-level, should the trend be considered.
Line 151 – 157: Declare variables that will store iADX() data points for each respective ADX line. Take note of the last parameters, which is the index of the data point element, where zero is the most recent data point.
Line 159 – 173: Filter out weak momentum with the main ADX line above the 20-level. Compare each +DI and -DI data points to decide to buy and sell. A crossover between +DI and -DI will trigger instructions accordingly.
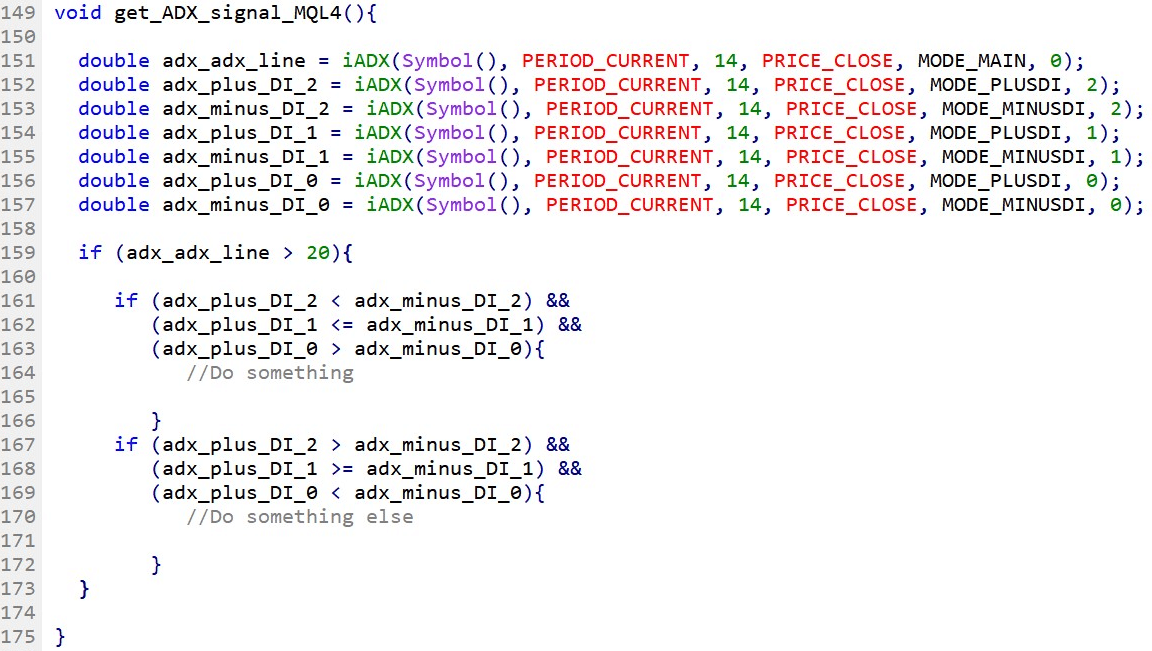
Fig.148 Check for +DI and -DI crossover and ADX strength in MQL4