The Accumulation and Distribution Indicator determines how supply and demand dynamics are influencing the price movement. The Accumulation and Distribution Indicator graph can move along the trend of the price changes, or it may move in the opposite direction.
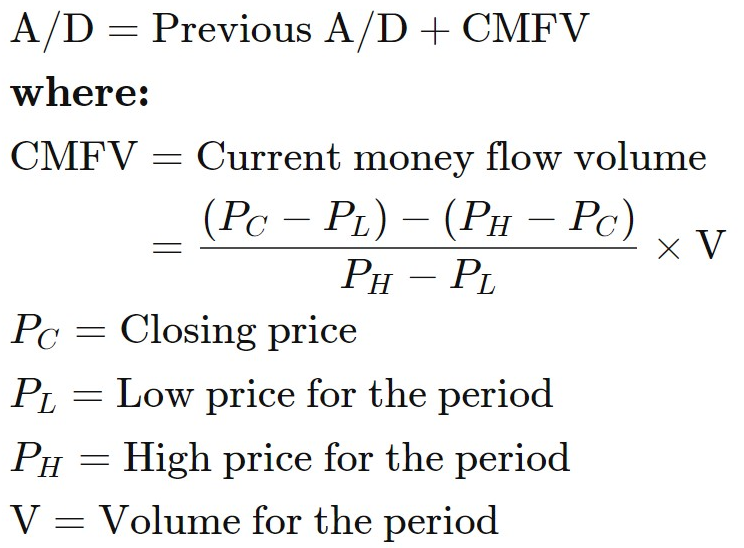
Fig.133 Accumulation and Distribution Indicator formula
As demonstrated by the Accumulation and Distribution index formula, the volume multiplier in the calculation provides a measurement for how strong the buying or selling was throughout a specific period. The formula defines whether the price closed in the upper or lower portion of its range. Consequently, when the traded instrument closes near the high of the period’s range and has high volume, it will result in a large Accumulation/Distribution rise. Conversely, if the price finishes near the high of the range with a low volume, or on the other hand, a high volume with the price near the middle of the range, the Accumulation/Distribution will not move up as much. The same concepts are also applicable to the price closing in the lower portion of the period’s price range. Both volume and where the price closes within the period’s range define how much the Accumulation/Distribution will decrease.
In this guide, we will go through how to identify a buy and a sell signal with the Accumulation and Distribution indicator and describe how to store the data points and how to collect them. MQL4 Accumulation/Distribution function retrieves the indicator’s data point, unlike MQL5, which requires the data to be saved in the buffer and in a declared “double type” array. It may seem confusing, but it is actually not. We will describe step by step this MQL5 specific feature. And finally, we will show you a practical example of usage.
How does the indicator signal work for the Accumulation/Distribution index?
Before we go into the Accumulation/Distribution index code implementation, let us clarify the buy and sell signals interpretation. The accumulation and distribution processes do not have a strict reading to define a signal. However, this indicator can help to spot price divergence and anticipate reversal by analyzing its trend against the instrument’s price action (Fig.134).
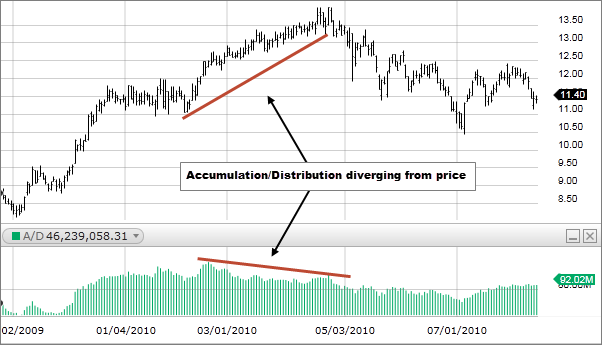
Fig.134 Example of Accumulation/Distribution divergence
How does the Accumulation/Distribution index store its data points?
The Accumulation/Distribution indicator maintains its data point in a dynamic array in the local buffer. The size of the array is handled automatically during the loading phase of the Expert Advisor. An indicator buffer is a time-series array, thus has the distinctive aspect of reverse indexing. It implies that the array is sorted by descending where the latest data point is on the left side of the array. Time-series is utilized to store historical data and include the time information.
Hence, the time-series element with index zero contains the latest indicator value of the symbol. For instance, an indicator on the daily timeframe will have the current indicator value at a price at index zero and yesterday’s data at the position index one (Fig.135).

Fig.135 Indicator data points array
MQL5
To retrieve the Accumulation/Distribution index data, MQL5 necessitates the use of the CopyBuffer() function. This method does not pertain to MQL4 as the MQL4 indicators function directly returns the value of the indicator data point instead of the handle. The following parameters must be supplied:
- Provide the handle that is returned by the iAD() function
- Provide the buffer number. You may input zero as the default value.
- Provide the start position. You may input zero to retrieve from the most recent data point. This number signifies the index where zero is the most recent data point, and one is the previous data point.
- Specify the amount of data point to get from the iAD() function
- Provide the variable where the data will be stored. The variable is a double type.
How to retrieve Accumulation/Distribution indicator data with CopyBuffer() function?
- Declare a variable for the handle: int IndicatorHandle = iAD();
- Declare a variable to store indicator data: double ad_indicator;
- Copy the data to the indicator variable and retrieve data points:
- CopyBuffer(IndicatorHandle, 0, 0, 100, ad_indicator);
- Retrieve Accumulation/Distribution data point with ad_indicator[0], ad_indicator[1].
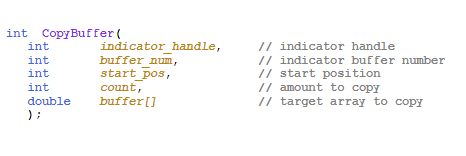
Fig.136 CopyBuffer() Function
How to access the indicator data?
MQL4
The iAD() function will return the graph point value according to these three parameters:
- The symbol of the traded instrument. You may input a string such as “EURUSD” or provide the function Symbol() to get the ticker from the chart where the Expert Advisor is attached to.
- Specify the time frame using the enumeration value from the constant ENUM_TIMEFRAMES, for instance:
- PERIOD_CURRENT, for the current timeframe from the chart,
- PERIOD_M1, for the one-minute timeframe,
- PERIOD_D1, for the daily timeframe.
- Provide the index of the indicator buffer where zero is the latest data point and one the previous data point.
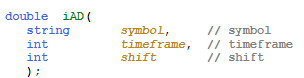
Fig.137 MQL4 Accumulation/Distribution function
MQL5
When calling the iAD() function, the function will build the Accumulation and Distribution Indicator in the MetaTrader global cache and returns its handle according to these three parameters:
- The symbol of the traded instrument. You may provide a string such as “EURUSD,” or you can employ the function Symbol() to collect the symbol from the chart where the Expert Advisor is attached to.
- Provide the time frame of the data point to extract using the enumeration value from the constant ENUM_TIMEFRAMES:
- PERIOD_CURRENT, to get data points from the current timeframe from the chart to which the Expert Advisor is attached to.
- PERIOD_M1, for the one-minute timeframe.
- PERIOD_D1, for the daily timeframe.
Note that to collect data points from the iAD() function, you need to combine iAD() with the function CopyBuffer().

Fig.138 MQL5 Accumulation/Distribution function
Practical case
MQL5
Fig.139 demonstrates the use of the Accumulation/Distribution indicator to generate a simple method to determine the trend.
Line 71: Declare the indicator handle and assign the content returned from the function iAD().
Line 72: Declare the indicator array that will store data points.
Line 74: Get the latest 100 bars and store them in the ad_indicator array.
Line 76 – 89: Conditional statement to compare the sequence of points to determine the trend of the Accumulation/Distribution indicator.

Fig.139 Evaluate the trend of the Accumulation/Distribution Indicator in MQL5
MQL4
Fig.140 demonstrates the use of the Accumulation/Distribution indicator to generate a simple method to determine the trend.
Line 94 – 97: Declare the Accumulation/Distribution previous points and get the data points from the function iAD().
Line 98: Declare the Accumulation/Distribution latest data point collected from the function iAD().
Line 100 – 113: Conditional statement to compare the series of points to define the trend of the Accumulation/Distribution indicator and execute instructions accordingly.
