The USDJPY, also nicknamed the gopher, is the second most traded currency pair in the global FX market. According to the Bank of International Settlement (BIS), the pair accounts for nearly 20% of the total traded volume in the global interbank market. This can be attributed to the strength of the economies behind both currencies, which have afforded them the safe-haven status from most of the world.
The large trade volumes the pair sees lead to relatively high volatility, which presents traders with the opportunity for profit from its price movements. Further, it is a highly liquid pair, which means traders can trade it in large quantities with ease. Due to its high demand, it also enjoys tight spreads, with most brokers quoting spreads of less than a pip during high volatility and high-volume periods.
Factors that move the gopher’s price
There are several factors that cause significant moves on the pair’s prices, which most traders stay on the lookout for. Let’s look at them below.
1. Both countries’ interest rates
For a long time, this pair was popular for its interest rate differential. This means the difference between the rate set by the US’s Fed and that set by the Bank of Japan (BoJ). This differential attracted a class of traders called carry traders, who took advantage of the rate differential to earn profits from trading the pair. However, following the Fed’s lowering of interest rates to combat the COVID-19 pandemic, this carry trade has become far less popular.
Still, any speculation of a rise in interest rates is bound to drive up the demand for a currency, which ultimately hikes its value on the forex market. A lowering of interest rates will have the opposite effect – a devaluation of the currency in question.
2. Monetary policy decisions by central banks
Other than setting interest rates, central banks are also tasked with coming up with monetary policy measures such as quantitative easing and inflation control measures. A central bank that adopts accommodative policies is said to be dovish, while one that takes on restrictive policies is said to be hawkish. A dovish central bank tends to be bearish for its currency, while a hawkish bank drives its currency’s value up.
3. Economic data
There are several economic releases from both countries that shed light on the state of their respective economies. These include employment numbers, Nonfarm payroll data from the US, trade balance numbers, GDP, retail sales data, and CPI. These releases are capable of causing short-term but significant shifts in the price of the USDJPY pair. Aside from economic data, the political environment of either of these countries is also a determinant of the value of their currencies.
4. Oil prices
Japan, unlike the US, has very few oil reserves. As such, it imports almost all of its oil demand. The US, on the other hand, only imports about half of the oil it consumes. Therefore, when global oil prices rally, they tend to have a much more detrimental effect on the JPY than the dollar, therefore driving the pair’s price up.
Trading the pair on multiple time frames
One of the most effective technical analysis methods is the multiple time frame analysis. This involves combining a long-term time frame with a short-term time frame to analyze the price chart of a currency pair. A longer time frame is used to identify the market’s long-term trend, which provides the trader with bias. It is always wise to trade in the direction of the market, as USDJPY’s charts are often characterized by long, sustained trends.
The shorter time frame is, in turn, used to identify opportune entries for trades. As a rule of thumb, always use a ratio of 1:4 or 1:6 when choosing the time frames to implement. This is to prevent you from using too small a time frame that is filled with noise, which can derail your analysis. For instance, if you choose to use the hourly chart to identify the prevailing trend, you can opt to use the 10-minute chart to search for entries, which yields a 1:6 ratio. Alternatively, you can use the 15-minute chart for entry identification, yielding a ratio of 1:4.
Working example
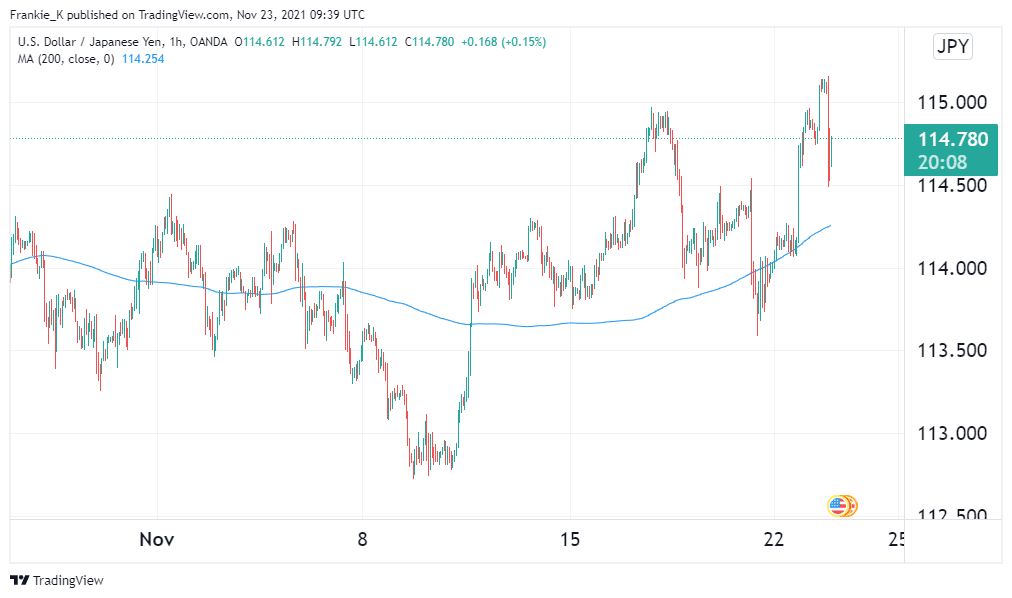
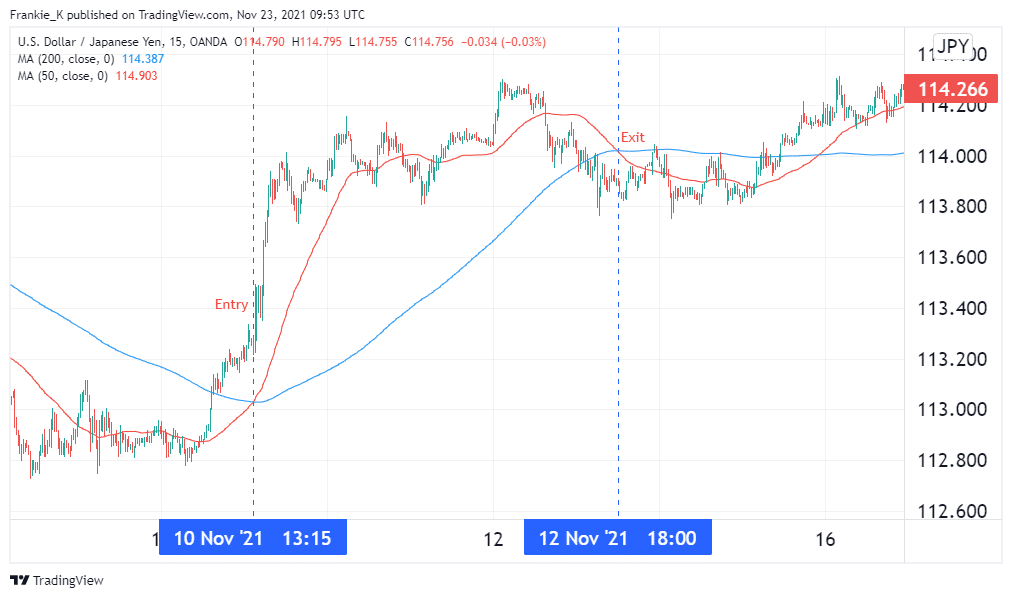
To illustrate this strategy, we shall be using the hourly chart and a long-term MA to identify the prevailing trend on the USDJPY price chart, which will provide us with a preferred direction for our trade. To find opportune entries, we shall utilize the 15-minute chart and the Moving Average crossover.

From the hourly chart shown above, we observed that the pair was in an uptrend from around 10th November. This was confirmed when prices broke above the 200-period Moving Average. Therefore, with this in mind, we shall be looking to enter a long trade when the opportunity presents itself.

Moving to the shorter timeframe, we use the 200 period MA in conjunction with a 50 period MA to find ideal entries for our buy trade. This came on the 10th of November, when the 50-period MA crossed above its 200-period counterpart, essentially forming the golden cross, a bullish signal. The exit signal came two days later when the shorter-term MA formed the death cross with the longer-term MA, which is usually a bearish signal.
Conclusion
The USDJPY pair is the second most traded pair in the world in terms of volume. As such, it enjoys relatively high volatility and tight spreads. Besides, USA and Japan being two of the world’s biggest economies in the West and East, respectively, their currencies are viewed by many as safe-havens. All these are major contributors to the pair’s popularity among traders. For best results, it is prudent to utilize multiple time frames when performing technical analysis on the pair.