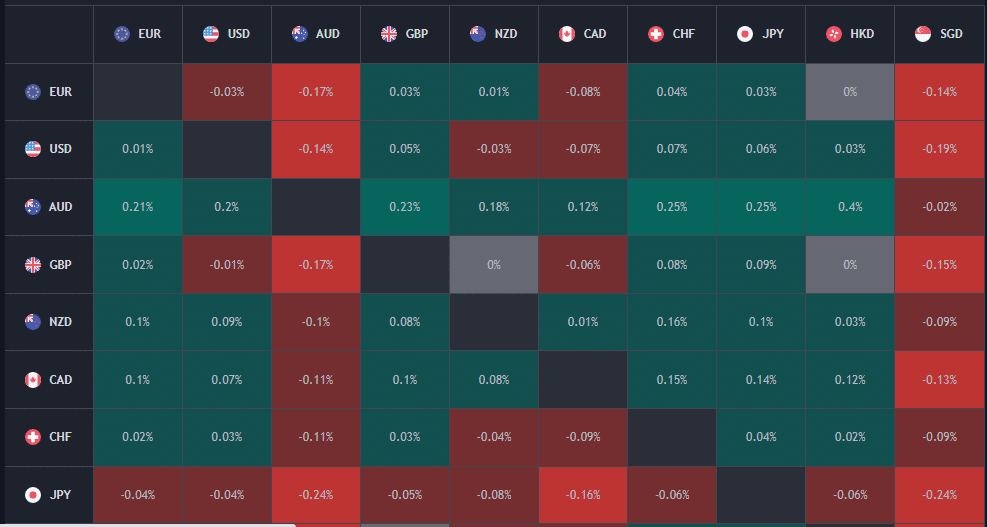
The Forex heat map is a visual representation of the forex market in real-time. It is employed to spot volatility in individual currencies and their strengths and weaknesses. The platform also confirms and verifies every entry in a transaction made on 28 currency pairs.
In the simplest terms, a heat map uses color codes to visually represent a great amount of data in the forex market. These colors make it easier for traders to understand the broader interrelationship between the exchange rates of different currencies in the market, as opposed to focusing on a single pair. Consequently, traders are able to spot several alternative trading opportunities without necessarily getting into complex technical analysis.
Colors of heat maps
- Green signifies a base currency appreciation versus the quote currency.
- Red signifies a drop in the underlying currency’s worth relative to the quote currency.
- Grey shows that the currency pair has not experienced any change in value.
Heatmap indicators highlight additional trade opportunities inside a group of paired assets that you may have overlooked while putting together your trade strategy. These are what we refer to as supplementary opportunities.
It also warns traders when they get contradictory signals, and that’s when they know it’s time to stay out of the market. Forex traders can benefit from a better understanding of forex trends since they can avoid misleading breakouts, false surges in price, and other such things.
What to look for when using the heat map
There’s nothing complex about the heat map layout: it’s quite easy to understand since it is hinged to the London, New York, and Asian sessions and tracks the performances of specific currencies.
The base currency is shown on the left, while the quote currency is shown on the right. For instance, EURUSD uses the euro as the base currency and the dollar as the quote currency.

On the top of each heatmap, you can see the current date and time, as well as how much time you have until the percentages reset to zero before a new trading session begins. In order to take advantage of hands-free operation, you have the forex heat map to update on your trading platform continually. It gives you a broader view of the market, and you can, therefore, trade and assess the market more easily.
Remember that the live currency heat map is dynamic, and you need to stay alert to any changes. For this reason, it is better that you use two screens. Place the heat map indicator on one screen and your trading platform on the other. This allows you to see both. Traders will benefit from the heatmap’s distinctive arrow system, which directs them to the pairs that should be considered for potential trading first.
The forex heat map is completely autonomous and is run on a server that provides market price data. We have an additional copy of the data, which is stored on a second server, and that data is backed up in a secondary server. The heat map lets you examine 28 pairs of currencies in total. It is available on the most popular trading platforms, such as TradingView.
Trading strategy with the live currency heat map
The live currency heat map is an excellent complimentary trading tool. Even though it’s an amazing tool on its own, the live heatmap signals get even better when combined with any of the other relevant technical analysis tools in trading systems. This allows you to make significant improvements in your trading results faster.
Some instances are provided below. However, all traders have to do their due diligence in order to explore additional situations:
Scenario1: A trader will receive an alert about the euro’s strength and maybe one or more other notification types related to the EURUSD pair, such as a sound for a price resistance breach.
The trader reviews the EUR pairs to make sure that the pair is showing constant strength, as shown on the heat map, and that the map is giving a consistent buy signal. Even if you don’t have enough conviction to enter the EURUSD trade, you may go with another EUR-related pair, which meets your other entry requirements better.
Scenario 2: The trader receives an alert on the live currency heat map that shows that GBP is rising. The trader reviews GBP pair charts, which are generally turbulent and range-bound.
There are inconsistencies on the heatmap where the EUR signals are showing up. The trader chooses to stay out of the market because the GBP’s charts are choppy, and the heatmap signals are unreliable.
In summary
Using technical analysis alone, you won’t be able to tell if a trend will continue; however, using the forex heat map, you’ll be able to see daily changes in one currency against many others.
It is advisable to use the information relayed by the heat map in conjunction with other technical and fundamental analyses.