Currency traders analyze pairs like the EURUSD and GBPUSD and then predict whether their prices will rise or fall. After conducting this analysis, you can place a buy trade if you believe that the price will rise.
Alternatively, you can place a sell trade if you believe that the currency pair will retreat. There are several methods of analysis, including technical, sentiment, and fundamental. In this article, we will look at the concept of technical analysis and explain how it works in forex.
What is technical analysis (TA) in forex?
The approach focuses on a chart, identifying patterns, and then predicting the future direction of a currency pair. The idea is based on the theory that you can use historical data to predict what will happen in the future. To do this type of analysis, traders use several key concepts. For example, they use indicators, identify key patterns, and then implement the trade.
Technical analysis is different from fundamental. The latter is the process of using economic data and news to predict what will happen in the future. For example, you can decide to buy a currency like the US dollar if you believe that the American economy is strong.
Because of this strength, the Federal Reserve will tighten by raising interest rates. Most forex traders combine technical and fundamental analysis in trading.
In TA, we focus on identifying repetitive chart patterns and predicting the future. For example, you can identify setups like triangles, wedges, and head and shoulders to predict the future direction of the currency pair.
Support and resistance in forex
A key component of TA in forex trading is known as support and resistance. These are possibly the most critical levels for a trader.
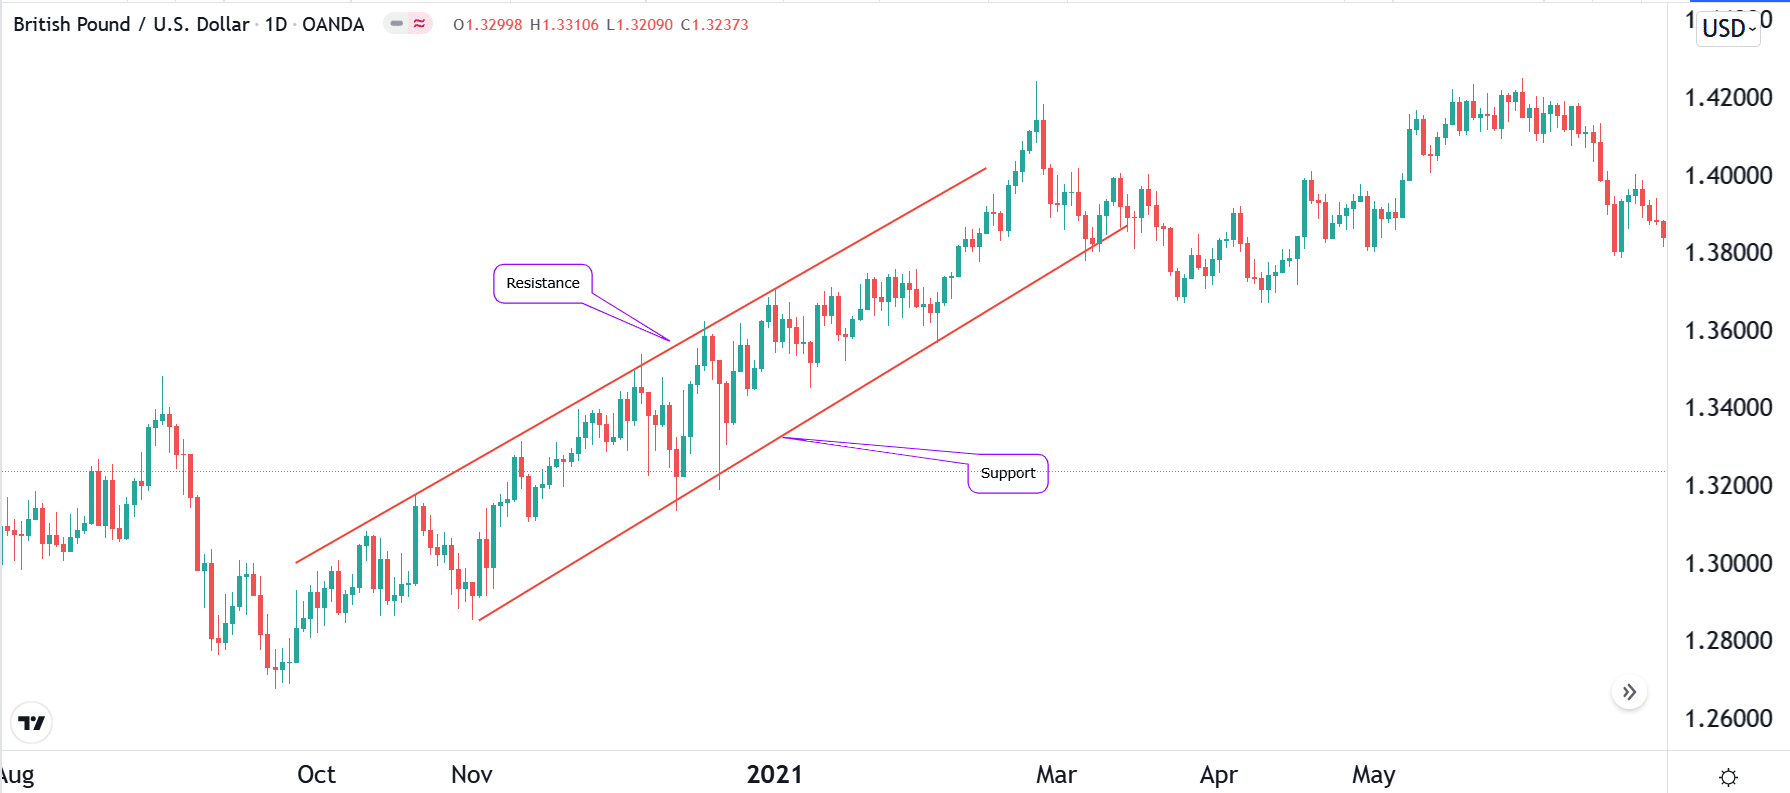
Support is an area where a currency pair struggles moving below. You can view it as a floor of the pair. On the other hand, resistance is a level where the currency pair struggles to move above. For example, assume that a currency pair is inside a channel of about 1.1200 and 1.1100. In this case, 1.1100 is the support, while 1.1200 is the resistance. The chart below shows the two lines in the EURUSD pair.

These two levels are critical because of the concept of fear and greed in the market. When a pair reaches a key support level, traders fear opening a sell trade below it and vice versa. In most cases, the pair tends to continue aggressively in the breakout direction after a breakout.
Technical indicators in trading
An essential part of TA is the use of technical indicators. These are tools created using mathematical formulas to help you predict the pair’s direction.
Trend indicators
There are several types of indicators. First, some tools identify a trend. These are Moving Averages, Ichimoku Hinko Hyo, Envelopes, and Bollinger Bands.
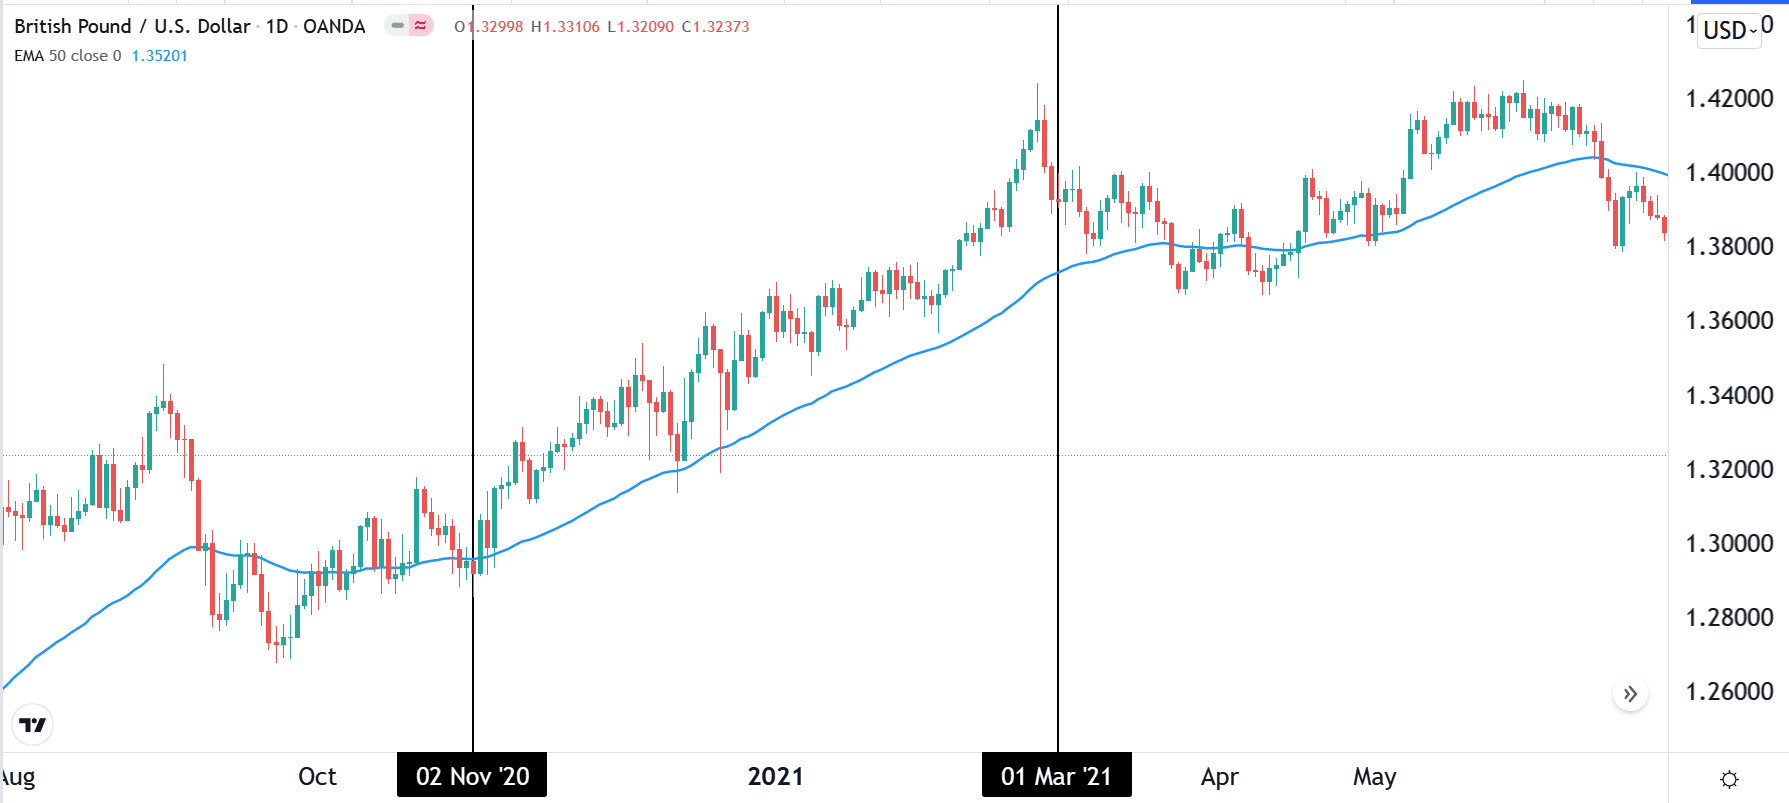
There are several ways of using these indicators. For example, you can use MAs in trend following. This is where you buy a currency pair as long as it is above the MA. For instance, you could place a buy trade in the chart below since the pair is above the 50-day MA. You should then exit the trade when it starts moving below the average.

You can also use Moving Averages to find reversals. A reversal is where a currency pair changes direction. A reversal would have emerged in the EURUSD pair above when the pair started moving lower. To do this, you can use two MAs of different lengths and then identify where they make a crossover.
Oscillators or momentum
Momentum indicators are those that traders use to determine whether a currency pair is seeing a strong momentum or not. Most of them are used to help traders identify overbought and oversold levels. When a pair moves to the overbought level, it sends a signal that it will likely keep rising for a while and then turn lower. They are also used to identify bullish and bearish divergences.
Some of the best-known momentum oscillators are the Stochastic Oscillator, Relative Strength Index (RSI), and momentum oscillator.
While some traders use oscillators separately, combining them with trend and volume indicators is the best method.
Volume indicators
Volume is an essential concept in trading. For example, if the EURUSD pair shoots up in a low-volume environment, it means that there is a likelihood that its price will resume the bearish trend. The top volume indicators are the money flow index (MFI), accumulation and distribution, and volume.
What other tools can you employ?
In addition, several other tools are used in TA. The most basic of these tools are known as trendlines. These tools help you draw lines in a chart, such as the above support and resistance.
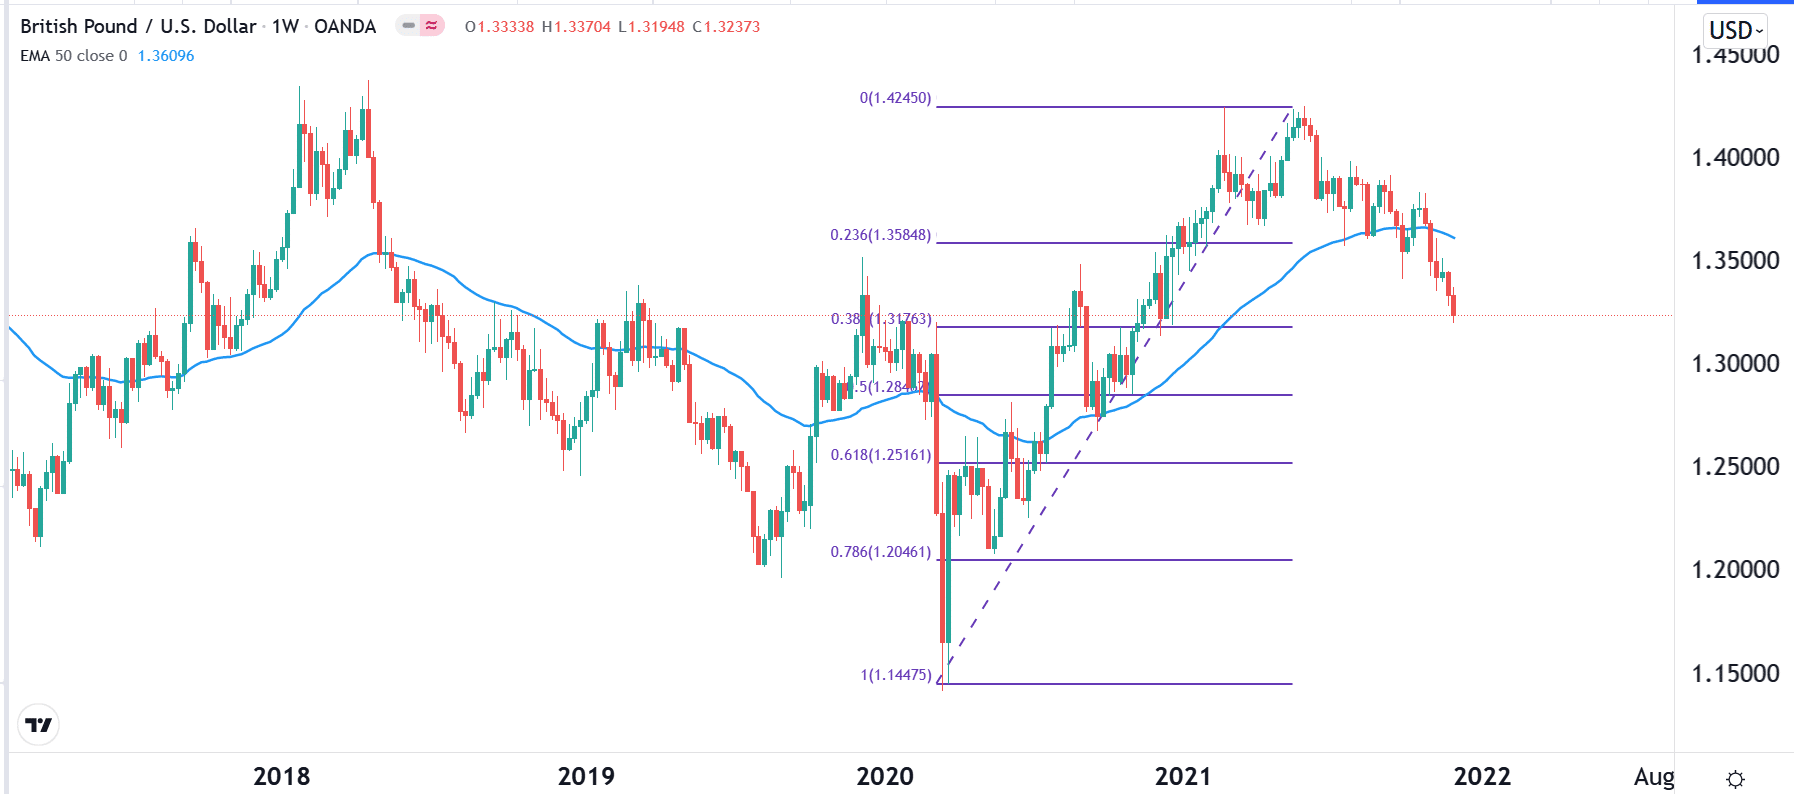
There is also a tool known as the Fibonacci retracement. This is a tool based on the Fibonacci sequence that you can use to identify support and resistance. As shown below, it is drawn by connecting a significant high and a significant low.

Other tools that will help you in the analysis are the Andrews and Schiff pitchfork, Gann box and Gann square, and pitchfan.
Summary
Technical analysis is an essential concept in forex trading. It is the easiest way to predict whether a currency pair will rise or fall in a certain period. In this article, we have looked at the TA and how to use it well.