Every forex trader worth their salt should know how to read and interpret price charts. This may involve using indicators to identify momentum behind market moves or even to point out the prevailing trend. It may also involve recognizing common chart patterns and predicting their most likely outcomes. The cup and handle is among the most famous formations. It is commonly used by traders and analysts alike the world over.
Definition
The setup can be a continuation or reversal pattern, depending on the direction of its breakout. More often than not, it will culminate in an upward breakout. An uptrend or a downtrend may immediately precede it. When preceded by a downtrend, an upward breakout from this chart formation makes it a reversal pattern. Similarly, when preceded by a rally, the price holding above the upper border of the setup suggests that the trend is likely to con upward breakout from this pattern makes it a continuation pattern.
When preceded by an uptrend, the cup and handle has increased the chances of culminating in a significant rally. This is because anyone who trades it will carry the advantage of trading in line with the prevalent trend. If you intend to trade this pattern, especially if a downtrend follows it, you should look for signs of waning selling pressure before the pattern’s manifestation.
Characteristics of the cup and handle
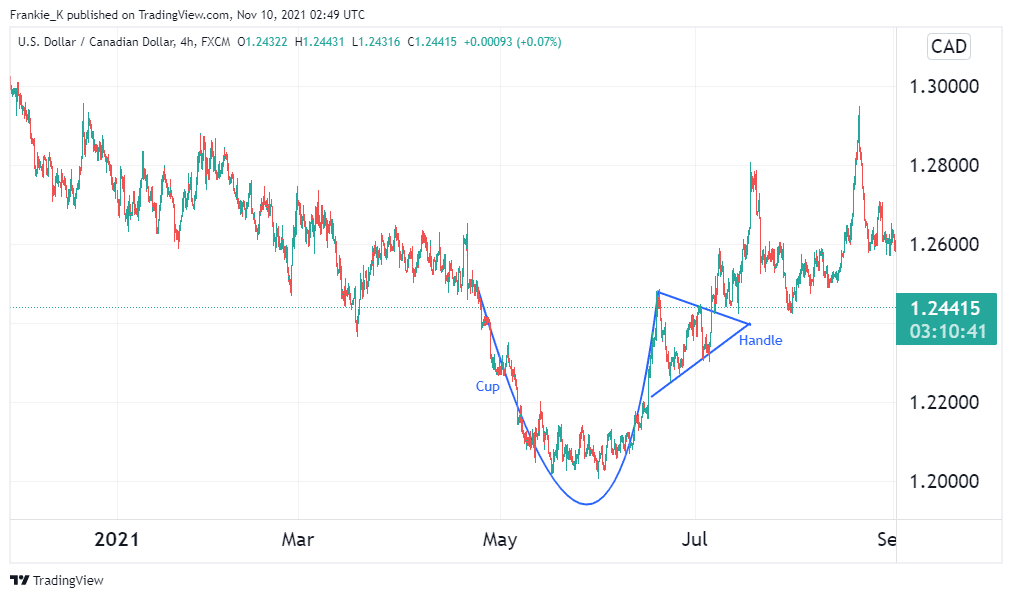
The setup manifests when prices stage a sharp downtrend, then become range-bound at the bottom for a short period. Immediately after this brief consolidation, prices stage an uptrend which more or less equals the prior decline in height. This forms a U-shape, which is the cup part of our pattern. Occasionally, this shape may be closer to a V in resemblance.
When this uptrend creates a new swing high, prices may consolidate horizontally to form a rectangle pattern or decline slightly to form a flag or pennant. This gives the handle part of our pattern. This handle should never oscillate below half the cup’s height. Ideally, it should only occupy the top third of the cup’s height. If it crosses into the bottom half of the cup, this pattern is no longer valid; hence it shouldn’t be traded.

The breakout from this pattern can be observed in a myriad of ways. First, you may wait for prices to close above the cup’s swing high. Another way would be waiting for prices to break out of the handle’s trendline. Either of these methods may generate the entry point for a buy trade.
Pros and cons of this pattern
Pros
- It is easy to point out for expert traders.
- It is effective in forex as well as the stock market.
- It features a clearly defined entry, exit, and stop-loss.
Cons
- It may be difficult to spot for beginner traders.
- Often necessitates the use of other technical indicators.
- Sometimes, the pattern takes a long time period to fully manifest.
The inverted cup and handle pattern
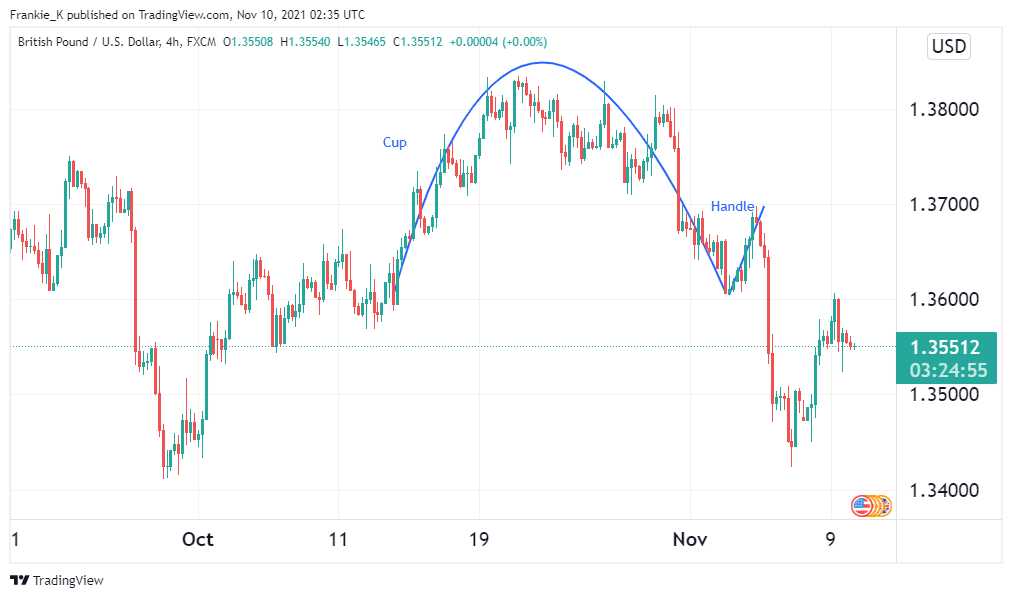
We have established that the conventional setup precedes a bullish breakout. Sometimes, the pattern will appear on a price chart, except it will be upside down. This means that it begins as a quick uptrend, after which prices slow down to form a consolidation range. Prices then fall drastically, eliminating all or almost all of the gains from the previous uptrend.
Instead of the U shape, the shape formed resembles an n. The handle, which is usually slightly sloping downward in the conventional cup and handle, now slopes upwards.

This inverse pattern often results in a bearish run. Due to this, some sources will refer to it as the bearish cup and handle pattern, while the conventional pattern becomes its bullish counterpart. The chart above shows an inverted formation in a GBPUSD four-hour chart.
Generating trade signals
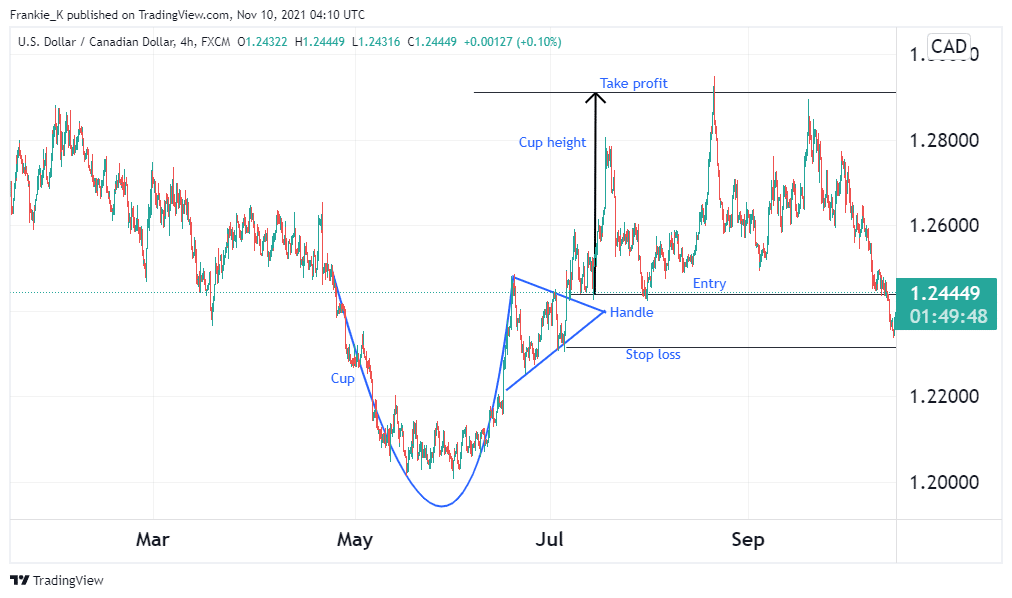
If you intend on trading the pattern, you must first wait for the handle to form. As aforementioned, this handle could form a horizontal channel or a descending triangle or channel. Your entry signal will be a break above this channel or triangle. Otherwise, you could wait till prices close above the resistance level created by the cup’s swing highs. Either way, you will obtain a suitable position to place your long trade.
Even if this pattern is almost always followed by a bull run, sometimes this is not the case. Therefore, it is always wise to employ a stop loss. This is to protect you from detrimental losses in the event the market goes against you.
The stop loss should be positioned under the handle’s lowest swing low. If the handle contains several swing lows, you may also use its last one. Now, you may recall that we established that the handle should never range below the halfway point of the cup. In a similar manner, a good stop loss should not be situated in the bottom half of the cup. In an ideal situation, the stop loss should be located in the top third of the cup’s height.

To obtain the profit target, measure the vertical height of the cup. Using this distance, measure it upwards from your entry position to obtain the take-profit level. If your pattern’s cup has different heights on either side, use the shorter height for a conservative take profit or the longer height if you think the asset can go higher.
Conclusion
An imminent bull run is frequently indicated by the cup and handle pattern. It operates as a continuation pattern when preceded by an upswing. Conversely, it is a reversal pattern when it is preceded by a downtrend. On a price chart, the pattern might also seem inverted, indicating an impending downturn. The handle must never fall into the bottom half of the cup for the pattern to be legitimate.