The Triple Exponential Moving Average is an indicator that works as both an oscillator and a momentum indicator. As an oscillator, it can help show when a currency pair has been overbought or oversold. As a momentum indicator, it can point out the level of the motivation behind price movements in the market. In addition, it utilizes Smoothed Exponential Moving Averages to cancel out irrelevant fluctuations so that it only shows valid, sustained price trends.
Calculation
In essence, TRIX comes from a triple-smoothed EMA. It measures the percentage rate of change of a triple-smoothed EMA. This means that to obtain a 10-period EMA, you have to follow the below steps.
- Obtain a ten period EMA based on closing prices.
- Obtain a ten period EMA of the EMA you obtained in step 1.
- Obtain a ten period EMA of the result of step 2.
- Obtain the 1-period percentage change of the result of step 3.
It is important to note that although typically, an EMA has minimal lag from price, every time you smooth it, it introduces more lag into your resulting indicator. However, this triple smoothing is what brings about the advantage of minimizing the noise caused by irrelevant price fluctuations. Only major price trends record changes on this indicator.
How it works
1. Crossing the zero line
First off, this indicator has a vertical scale with a zero centerline, a positive region above it, and a negative region below. When the TRIX line crosses above the centerline from the negative zone, it points to a bullish trend. Alternatively, when it crosses below the zero line from the positive zone, it signifies a prevailing downtrend.

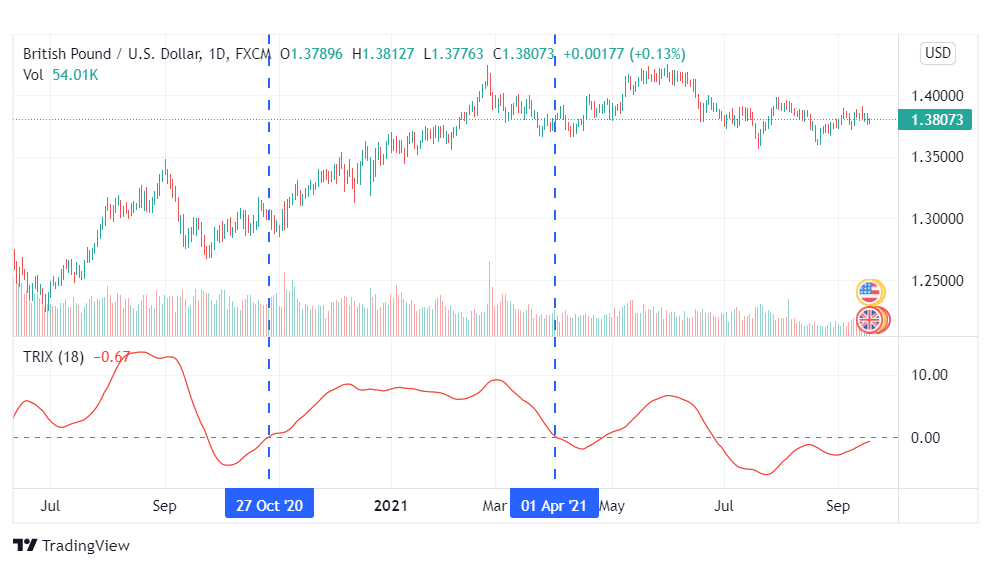
Chart 1: TRIX zero line cross on a GBPUSD daily chart.
From the above chart, it is clear that this indicator can give suitable trading signals. On 27th October, the TRIX line crossed above the zero line, giving us our buy signal. The GBPUSD pair continued its uptrend for months until the 1st of April when the indicator gave the exit signal.
2. Crossing a signal line
As is evident in chart 1, the entry and exit signals from this indicator are not optimal. To maximize their gains, some traders opt to add a signal line to the TRIX indicator. This signal line is, in essence, just a Moving Average of the indicator.
The way this strategy works is that once the TRIX line crosses below the signal line, it gives off a bearish signal. On the flip side, if it crosses above the signal line, it points to an incoming uptrend.
Apart from the improved signal precision, this strategy has the advantage of being useful in both trending and consolidating market periods. When the market is trending, a crossing past the signal means resistances and supports have been broken out of, and the trend has resumed. On the other hand, in a consolidating market, hovering around the signal line will mean resistance/support levels are holding.
3. Divergence
A divergence occurs when the TRIX oscillator and the price curve are moving in different directions. When the oscillator is in a downturn while prices continue moving upwards, this could mean a bearish reversal is about to happen. Similarly, if the oscillator rallies while prices maintain a bearish trend, this is a sign of an incoming uptrend.

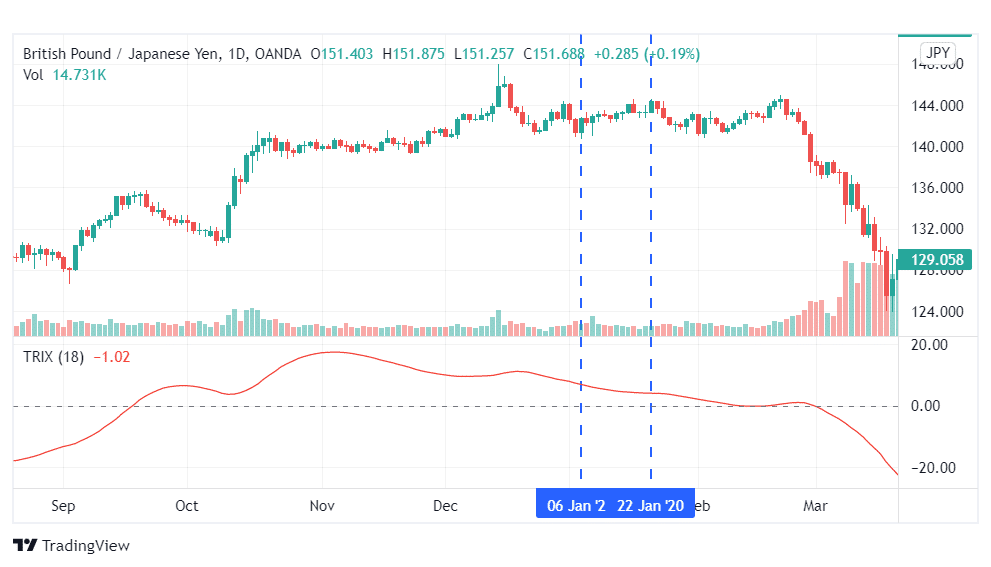
Chart 2: Bearish divergence
In the example above, the GBPJPY pair was in a slight uptrend for most of January 2020. However, the indicator recorded a downtrend, which pointed to an incoming bearish run. True to this prediction, the pair’s price dwindled significantly in the following months.
Maximize your trading gains
All forex trading is a game of chance, never certainties. A signal from one indicator gives likely situations, but if you can manage to verify your signals from a different source, your chances of turning a profit are significantly increased. For this reason, most traders use the TRIX indicator in partnership with other indicators.
TRIX and RSI blend
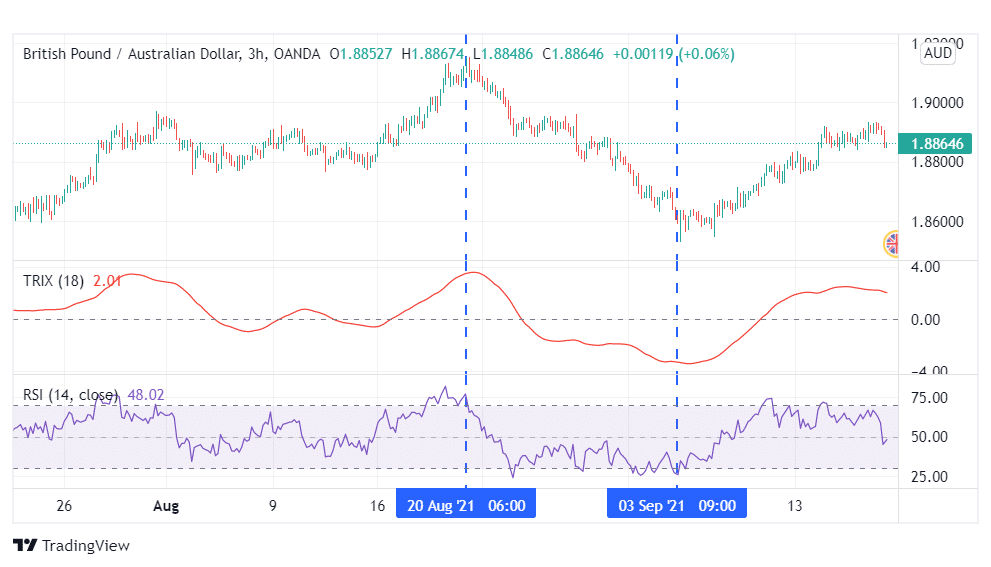
From the example below, we can see the RSI cross into the overbought region in August, forecasting an impending downturn. Hours later, the TRIX indicator peaks and starts declining, which confirms the validity of our bearish signal. This gives us an entry position for a short trade.

Chart 3: TRIX and RSI blend
In early September, the previously declining TRIX flattened and slowly began to rally, signifying an incoming bullish reversal. Similarly, RSI shows the GBPAUD pair as oversold, which confirms the bullish reversal, giving the exit signal to our short-sell position.
TRIX and MACD blend
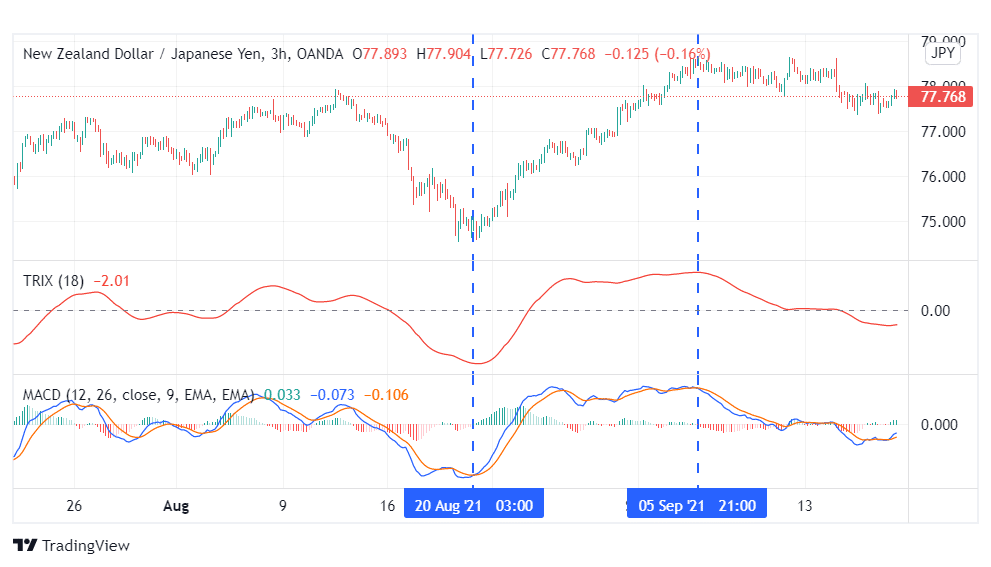
As is evident from the chart below, these two indicators give complementary signals. On 20th August, the TRIX indicator began an uptrend after recovering from a bearish run. This signified the start of a bullish run for the NZDJPY pair. At the same time, the MACD, line crossed over its red signal line, giving another bullish signal. This gave the opportune price to open a long position.

On the 5th of September, TRIX plateaued and began a downtrend. This was the first sign of the end of the bull run for the pair. The MACD, on the other hand, crossed below its signal line, giving our second bearish flag. This gave the exit signal from the long position.
In a nutshell
The TRIX indicator works both as an oscillator and as a momentum indicator. It is a useful tool for medium-term and long-term traders as it only points out major price trends. It can give trade signals by crossing its zero line, crossing its signal line, or showing divergences between itself and the price curve., TRIX is often paired with other indicators such as the RSI and MACD to increase the probability of success of its signals.