In the FX market, it always pays to trade in tandem with the prevalent market direction. However, it is not uncommon for traders to open positions in the direction of a seemingly strong trend, only for a reversal to happen and drive them to losses. The Average Directional Movement Index (ADX) remedies this by pointing out the strength and direction of the market move. With this tool, traders can easily determine when the market is in a robust trend and when the momentum behind a movement is waning.
ADX calculation
When engineer-analyst Welles Wilder formulated the ADX, he intended to follow the momentum. Therefore, a rising index points to a strong trend, while a declining ADX implies that momentum is waning.
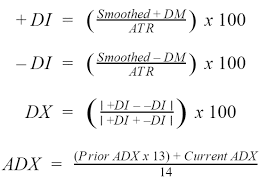
Typically, this tool features three lines. One is a positive directional index (+DI), the second a negative DI, and the third an ADX line. Here’s how we obtain the three lines.

Where +DM is obtained by subtracting the previous high from the current high, -DM by computing the previous low current low, and ATR is the Average True Range.
Typically, we use a 14-period timeframe for these calculations, but you can adjust the number of periods according to your needs.
How to interpret ADX signals
Most charting platforms will offer this indicator on a separate window below the price chart. Its scale reads from 0 to 100, with a 20 or 25 level threshold. When the ADX line reads above this threshold, it implies that the prevailing has enough momentum behind it to facilitate trades in its direction.
Readings above 40 or 50 would indicate a powerful trend, which would pave the way for even larger profit potential. Conversely, when the ADX line reads below this threshold, it is indicative of a weak trend. For this reason, traders should avoid placing trades in tandem with such a move.
The directional indexes determine the direction that prices take. When the positive DI line crosses above the negative, it points to a market that’s going up. Similarly, whenever the -DI line is above its positive counterpart, it implies that the market is in the downturn.

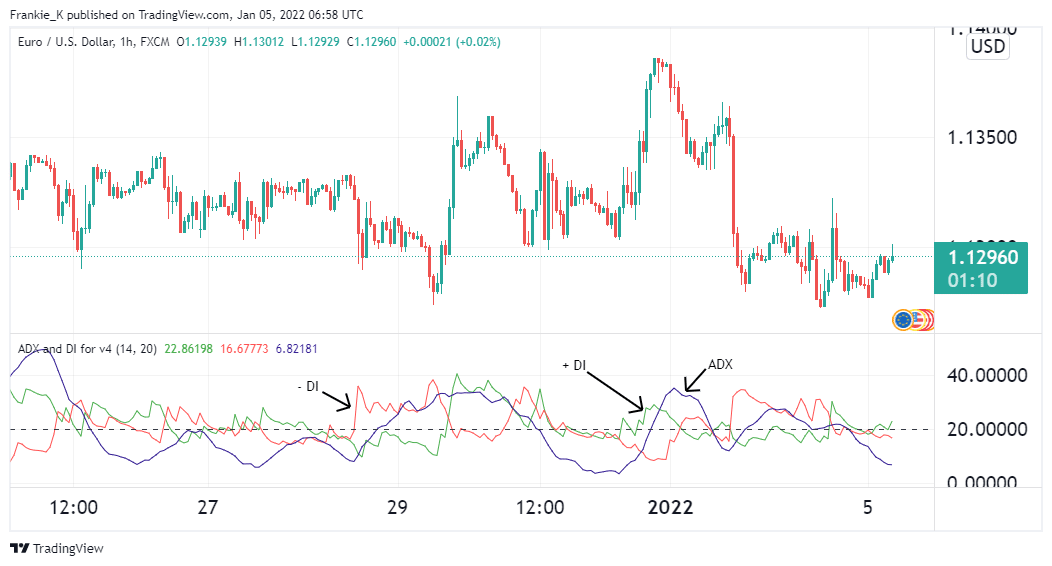
The illustration above shows the ADX indicator on a EURUSD chart. Notice how the red -DI line crosses below the green +DI whenever the pair is bearish, and the +DI stays above the -DI when the pair goes bullish. Further, you can see whenever the blue ADX line reads over 20. The prevalent tendency should be a strong one.
ADX advantages
This indicator can be used to pinpoint ideal entries and exits for FX traders. Some traders may opt to use the threshold, whether 20 or 25, to place their trades. However, this may present a risk as a cross above 25 may manifest at the beginning of a movement or at the end when its momentum is fading. For that reason, some traders will utilize higher ADX readings, such as 30 or 40.
Further, if the ADX continually makes rising peaks, it is indicative of a strengthening move. Therefore, it would be wise to follow the direction of the prevalent direction. In contrast, when the indicator’s peaks gradually get lower, it may point to a reversal in the works.
Common risks associated with the ADX
Using the ADX line without the +DI and -DI lines may prove difficult to determine direction. Further, the tool does not have clear guidelines on when to exit open trades. This leaves traders to set up arbitrary ADX levels for exiting trades in accordance with their strategies.
Additionally, the ADX is inherently lagging. This means that any signals obtained from it emanate from past data and thus may sometimes prove inaccurate. Most traders opt to combine the tool with other similar indicators for signal confirmation to remedy this.
Top ADX approaches
1. Trading high momentum crossovers
Let’s look at the most popular method. When the ADX is displaying high momentum, traders seek crossings between the +DI and -DI lines. When the +DI crosses over the -DI line and the ADX reading is above 20, traders are prompted to initiate long trades. This is because such numbers indicate a market in a strong rise.
Similarly, when the -DI crosses above its positive counterpart, it points to a prevalent bearish environment. If the ADX reading at the crossover point is above 20, it gives the impression that the downtrend has strong momentum behind it, and thus short trades would be apt at this juncture.

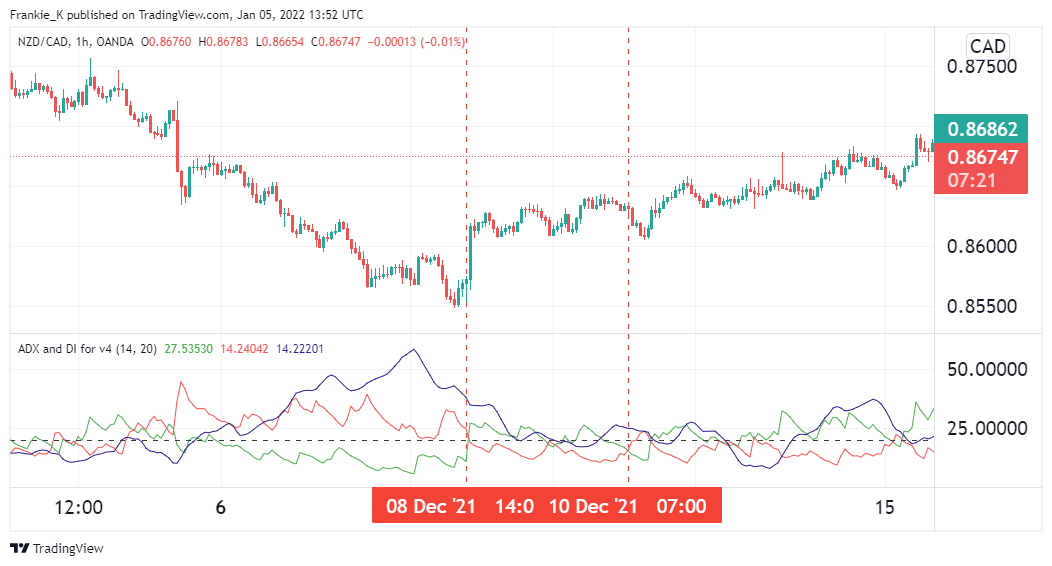
In the image above, the DI lines gave a bullish crossover on December 8. Concurrently, the ADX line was reading above the threshold level at 25. This was indicative of a strong uptrend, which prompted the opening of a long trade. On December 10th, the bearish crossover manifested. What’s more, at the time of the latter crossover, ADX was above 25, which pointed to a strong downtrend. This marked the exit of our long trade.
2. Combining the ADX with other similar indicators
One tool that can prove helpful when paired with the ADX is the MACD. This tool measures the market direction and momentum and can thus confirm trade signals generated from the ADX. One can also pair the ADX with the RSI, as the latter helps point out accurate entry and exit positions by identifying oversold and overbought price levels. This dramatically improves the precision of trade signals obtained.
Conclusion
If you intend to utilize the ADX in 2022, you should know how to read its signals and gauge the strength of the momentum behind a trend using the tool. However, though it has its fair chances of success, it is not prudent to use the tool as a standalone indicator. The best practice would be to pair it with other indicators such as RSI and MACD, which would increase the precision of obtained signals.