Of all tools used in the forex market, only a handful are leading indicators. The Money Flow Index is one among the select few leading ones. Though it is inherently a momentum gauge, it differs slightly from other popular oscillators like the RSI. The latter utilizes prices in its calculation, whereas the MFI considers both price and volume data. In forex, volume tends to precede price, which is how the MFI lends itself to being a leading indicator.
Defining the MFI
The MFI measures the inflow and outflow of money into a currency pair over a given period. This reading helps inform traders where most market participants are leaning, whether on the buy-side or sell-side. This way, they can obtain an appropriate trading bias.
In essence, the MFI works similarly to the RSI, except it has a volume component in its calculation. The global FX market is decentralized, which presents hurdles in obtaining accurate volume data on currency pairs. Some brokers provide this data, but it will more often than not only include data from their clientele and their liquidity providers, as opposed to the entirety of the FX market. Some platforms will utilize tick data, while others utilize futures contracts on currency pairs to remedy this.
How to calculate it
The MFI is presented on a screen in a separate window below the price chart, whose scale reads from 0 to 100. We can obtain the MFI score at any given period by following the steps below.
1. Calculating the typical price
The typical price over a given period is obtained by finding the average of the high, low, and close prices of said period.
TP = (High + Low + Close)/3.
2. Calculating the money flow
This is obtained by multiplying the typical price by the volume (TP * volume). Therefore, if we obtain a new typical price that’s higher than its previous score, then that will result in a positive money flow. This implies that investors are buying into our currency pair. Conversely, a lower TP than before leads to a negative money flow, which shows that investors are shorting the pair.
3. Obtaining the money ratio
This is a ratio of the positive money flow to the negative money flow.
4. The MFI
Once the money ratio is obtained, the MFI can be obtained by computing:
MFI = 100 – (100/ (1 + Money ratio)).
How to read MFI signals
At its core, the MFI is an oscillator. This means that its most common use case will be identifying oversold and overbought levels. Originally, the minds behind this tool proposed to use levels of above 90 to indicate overbought levels, while a score of below 10 would indicate that the pair was oversold.
However, on applying the indicator to the live market, traders found that these levels were seldom reached. Following this observation, they elected to change these thresholds to 80 and above for overbought and 20 or below for oversold. There is also a centerline at 50. A reading above this line points to strong bullish momentum, and anything below points to bearish pressure in the market.
The MFI can also be used to point out divergences with the price chart. If the indicator rallies while prices plummet, it points to an increasing buying pressure, which may well lead to a reversal to the upside. This presents traders with a unique buying opportunity. In the same way, if the tool keeps reading lower and lower while prices rally, this presents traders with an opportunity to short the pair at the height of its rally.
During strong trends, prices will often stage a pullback before resuming the original trend. The MFI can be used to point out the end of such retracements, which can provide traders with opportune entries into a strong market move. In an uptrend, for instance, this would be marked by the MFI going below 20, then trending up again to cross above the 20 mark.
Examples of using the MFI
1. Ranging markets
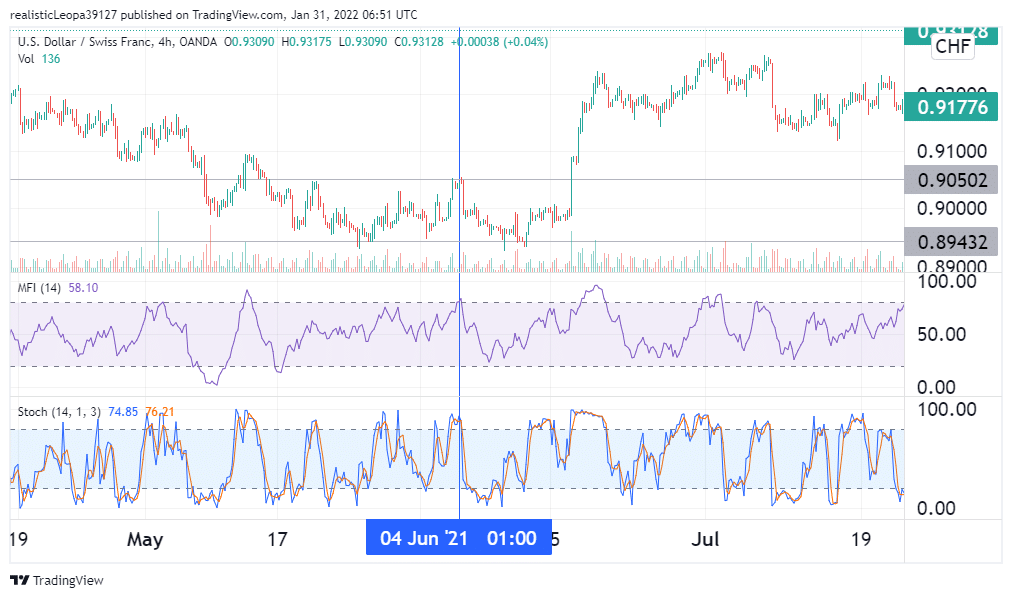
When prices are in consolidation, they tend to adhere to critical levels better. To that end, we can use the MFI to identify when prices approach resistance, and the reading is overbought, or when it reads oversold just as prices approach a support level. Both of these instances are signs that a reversal is imminent. For signal confirmation, we shall utilize the Stochastic Oscillator, which yields similar oversold and overbought signals.

In the image above, the USDCHF pair was in consolidation, and an overbought reading by both the MFI and Stochastic provided an entry signal for a short trade.
2. Trending markets
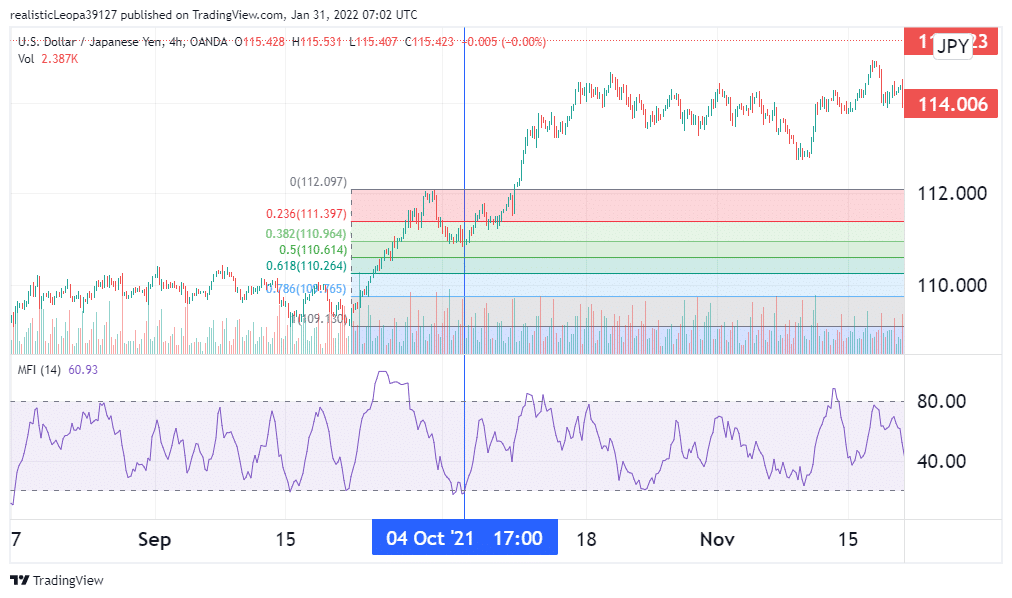
We established that the MFI could come in handy in spotting the end of retracements during strong, sustained market movements. In an uptrend, this would manifest as the MFI going below 20, then back up again as the retracement ends and the prior trend resumes. In a downtrend, the MFI would go overbought then back down again into safe territory. For signal confirmation, the Fibonacci retracement tool works best in this situation.

In the illustration above, the USDJPY pair was in a strong rally in October. The retracement came on the 4th of that month as the MFI spiraled downwards. The end of the retracement was marked by the MFI going back up above 20 and was confirmed by the 38.2% Fib retracement level. This gave an ideal opportunity for a long trade.
Conclusion
The Money Flow Index is a tool used to follow the money flowing in and out of a currency pair. This metric is a useful window into the sentiment and thus can inform traders of the right trade direction. Like other oscillators, it yields overbought and oversold signals, as well as divergences. It can be utilized for both trending and ranging markets.