The term volatility is often thrown around in forex market publications and articles, but what does it really mean? It refers to the rate of change of a currency pair’s price. If a pair’s price fluctuates significantly over short periods of time, it is said to be highly volatile. Conversely, when the pair’s price is in consolidation, it is said to have low volatility. As you can imagine, day traders will always prefer highly volatile pairs since they promise a larger profit potential.
Historical volatility (HV) vs. implied volatility (IV)
Historical volatility provides a measure of how much prices deviated from their average value over a specified period of time. It is based on past data, hence its nomenclature. It is measured from price charts by analyzing how far the peaks and troughs are from the average.
Implied volatility, on the other hand, attempts to predict how volatile a currency pair or any other financial instrument will be in the foreseeable future. This IV is mostly utilized by options traders. To obtain this metric, traders often use the four CBOE indices, which quantify the market consensus on the volatility of currency pairs over the coming 30 days.
The HV indicator
We have established that historical volatility is easily discernible from currency price charts. To that end, traders utilize the historical volatility indicator, which appears as a line chart on a separate window below the price chart. The indicator comes preinstalled on popular charting platforms such as TradingView, but MetaTrader users have to manually install it.
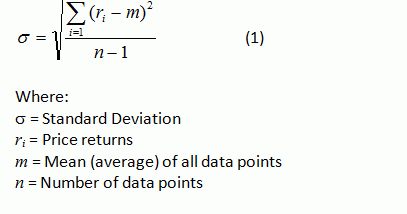
The HV’s calculation is a tad difficult, but it is seldom necessary for traders to require a firm grasp of the formula behind it. What’s important is that traders know how to apply it to predict future price moves. That being said, here is the formula for calculating the HV:

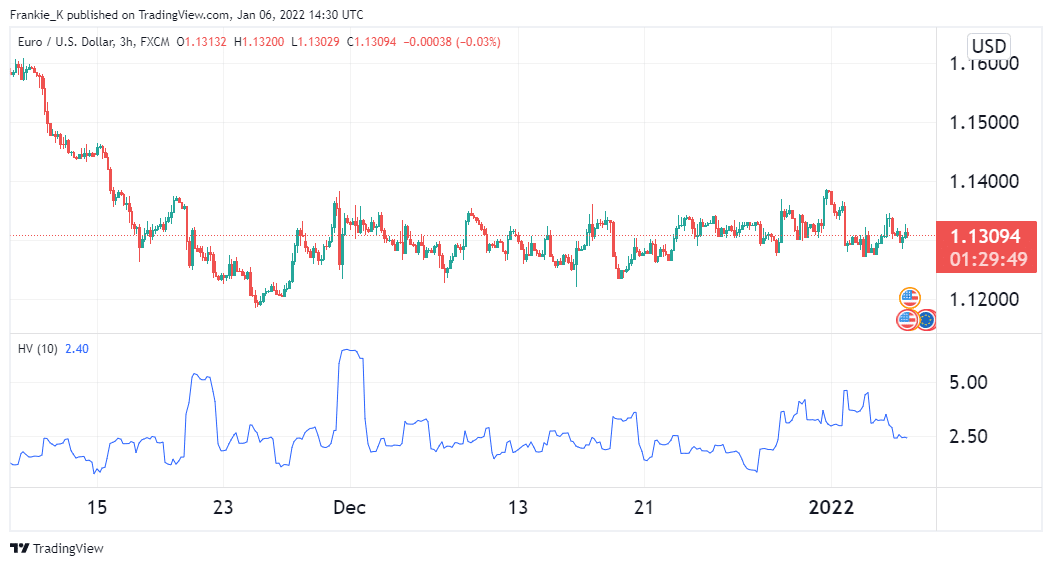
The illustration below shows a 3-hour EURUSD chart featuring the HV indicator.

Notice how sharp price moves coincide with the spikes in HV.
How to utilize the HV indicator
Unfortunately, the HV indicator does not give trade entry and exit signals in the manner that most indicators do. In effect, it draws our attention to when we should be taking a closer look at a currency pair’s price action.
For instance, you may notice a spike in the HV on the NZDUSD price chart right after an unexpected policy decision from the RBNZ. This should prompt you to research the policy decision and the likely effect it will have on the pair, whether in the long or short term. This would then serve to inform the appropriate trade under the circumstances.
For this reason, if you intend to incorporate the HV indicator in your forex trading strategy, you need to use it in conjunction with other indicators. Popular combinations include pairing the HV with the Average True Range (ATR), Moving Averages, and Bollinger Bands.
Popular HV indicator combinations
1. Historical volatility and moving averages strategy
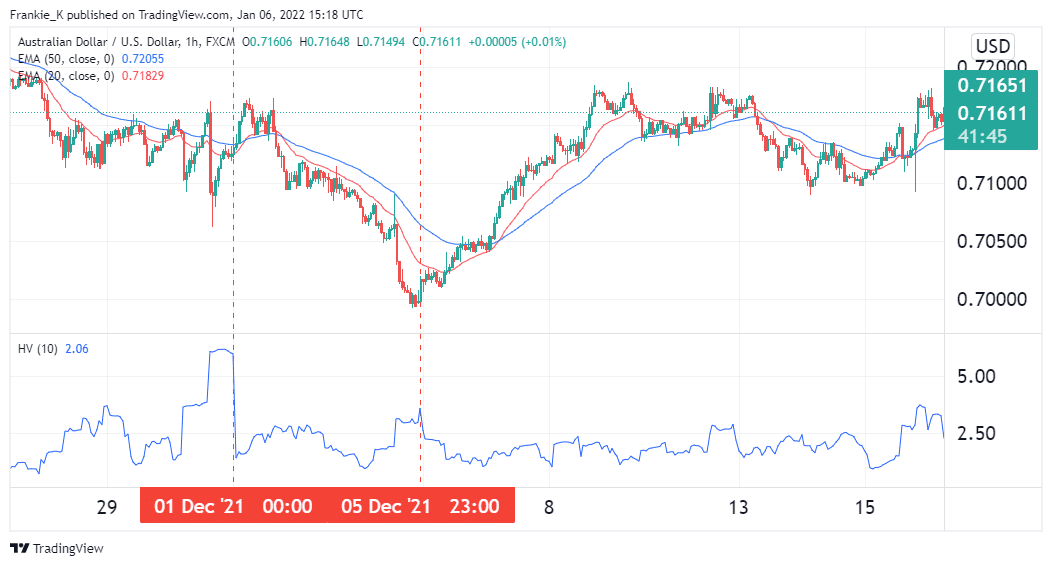
The illustration below shows an hourly AUDUSD chart featuring the HV indicator and moving averages. On 1st December, 2021, the HV chart recorded a spike in volatility. At the time, the AUDUSD pair was trending upwards.

On taking a closer look at the fundamentals of the pair, the 1st of December marked the release of ADP non-farm payroll data in the US. This is usually a measure of the change in the non-farm payrolls from the previous month. On this date, the actual change exceeded investor expectations by 9,000 additional jobs. This was extremely bullish for the dollar, which meant that AUDUSD’s price would most likely trend down.
Further, on the same date, the Australian Bureau of Statistics reported that the number of home loans fell by 4.1%, against a predicted rise of 1%. Additionally, Australian retail sales turned out exactly as predicted by analysts, at 4.9%. Therefore, the overall effect of the data released was bearish for the AUD.
Moving on to technical analysis, later that evening the Moving Averages manifested a bearish crossover, which confirmed the prediction that the pair was on the downtrend. This prompted the opening of a short trade. The trade’s exit signal came on December 5th, when volatility spiked again and moving averages displayed a bullish crossover.
2. HV and Bollinger Bands strategy
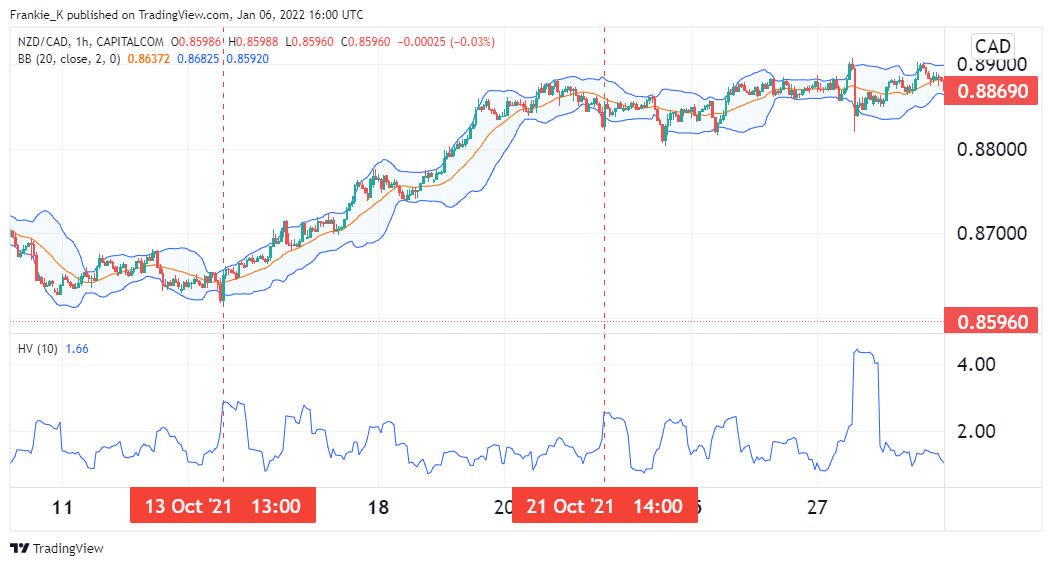
The image below shows the historical volatility indicator is paired with Bollinger Bands on an hourly NZDCAD chart. On 13th October, the pair recorded a spike in volatility on the HV indicator. Almost immediately, prices broke above the middle band of the Bollinger Bands indicator, which is usually a bullish signal. This called for the opening of a long trade for the pair.

A few days later, on the 21st, after a consistent bull run for the pair, the HV indicator recorded another spike in volatility. A few hours earlier, prices had broken below the middle Bollinger band from above, which is a bearish flag. This was the signal to exit our long trade.
Other than the historical volatility indicator, there are other alternatives that measure market volatility. These include the standard deviation and the average true range. Both of these indicators may be used in place of or in conjunction with the HV.
Conclusion
The Historical Volatility measures the movement of a currency pair’s price over a specified period in the past. This metric can help inform when the price action of a pair is undergoing major shifts, which presents opportunities for traders to profit from the large moves. Since the indicator does not produce actual trade signals, it should be paired with other tools such as Moving Averages and Bollinger Bands. Traders should beware of trading the actual spikes, but instead, research on the cause behind the increased volatility to inform their trading decisions.