The GBPUSD pair is dubbed the Cable after the first communication cable was laid across the Atlantic to connect the UK and US. Today, it is the third most traded pair after EURUSD and USDJPY. This can be attributed to the strength of the two economies, which has seen most people in the world use their currencies as safety reserves.
Further, due to the dominance of the two economies, getting fundamental and economic information on their economies is pretty easy. This is a big help to traders in their analysis efforts. The pair also enjoys relatively high volatility and liquidity, which facilitates easier trading.
When’s the best time to trade the pair?
If you’re an FX trader looking to dabble in this pair, you will typically want to trade it when most of its market participants are active. With the high volume comes high volatility, which translates to an increased potential for profit. Further, during such periods is when the pair’s liquidity is highest, which means you can enter and exit positions with ease, no matter how big your positions may be.
To that end, the pair’s traded volume tends to spike during the European session. This is because most economic reports from the UK that move the pair are released at this time. The New York session is also marked with high volumes and volatility for the pair since this is when most American data will be released. Therefore, the opportune window to trade this pair would be from 0600 GMT, just before the London session opens, to 1600 GMT, an hour after the overlap between London and New York sessions.
Factors that affect the Cable’s price
The economies of these two countries are closely related, as the US is the main destination for most of the UK’s imports. To that end, there are several economic indicators that move this pair’s price.
1. The state of both economies
Usually, global demand for a currency depends on how well the economy behind the currency is doing. This means that when the UK economy is thriving while that of the US struggles, the pair rallies. Similarly, if the US economy seems the stronger of the two, the pair’s price declines.
2. Central bank policy
The UK’s central bank, the Bank of England (BoE), meets every month to discuss monetary policy and its stance on interest rates. In the US, the Federal Reserve meets every six weeks to do the same. When either of these banks decides to lower interest rates and adopt accommodative monetary policies, they are said to be dovish. A dovish central bank tends to be bearish for its currency.
On the other hand, if either of these banks decides to raise interest rates or adopt stringent monetary policy measures, they are said to be hawkish. A hawkish bank is positive for its currency.
3. The political environment
The political situation in both of these countries can have a significant effect on the exchange rate between their two currencies. This was evident in the recent Brexit proceedings, which saw the pair fall drastically. Similarly, elections in both of these countries move the pair, depending on who wins.
4. Economic data
There are several economic reports that shed light on the state of each of these countries’ economies. Usually, such releases have short-term effects on the pair’s price. Such reports include retail sales, employment data, and inflation levels.
Multiple time frame analysis
This refers to the practice of using charts in more than one timeframe to make trading decisions. This technique usually entails the use of a chart on a higher timeframe to identify the prevailing market trend, which provides the trading bias. In the forex market, it is always advisable to trade in the direction of the market.
| Trader type | Holding duration | Trend time frame | Entry time frame |
| Long-term | Days, weeks, months | W1 | D1 |
| Swing | Up to a few days | D1 | H4 |
| Short-term | Less than a day | H4 | H1 |
| Scalper | Hours | H1 | M15 |
The second step involves doubling down onto a smaller time frame to identify opportune entries and exits. As a rule of thumb, one should use a ratio of 1:4 or 1:6 when choosing between timeframes. The table above shows the best time frames as they suit different trader types.
Trading example
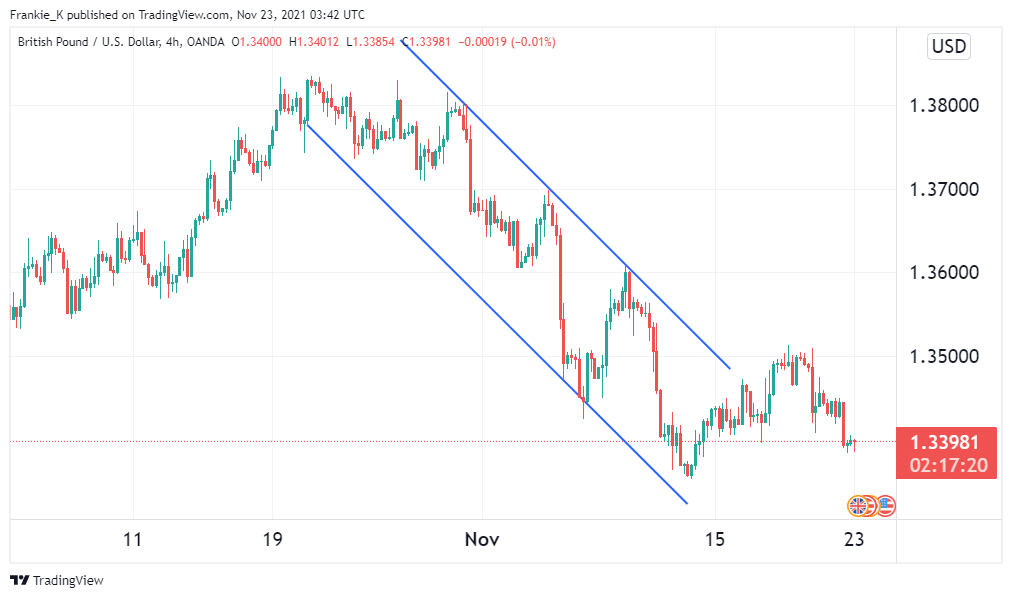
For the sake of argument, let’s assume we’re a short-term trader looking to make a profit from trading the GBPUSD pair. From the above table, we found that the appropriate time frames to use for our analysis would be the four-hour chart to give us the trading bias and the hourly chart for entry signals.

Looking at the four-hour chart above, we can see that the pair was in a downtrend from late October to mid-November. We shall take this as our trading period. This negative trend means that we will be looking to enter short trades whenever we get the appropriate signal. Enter the one-hour chart.

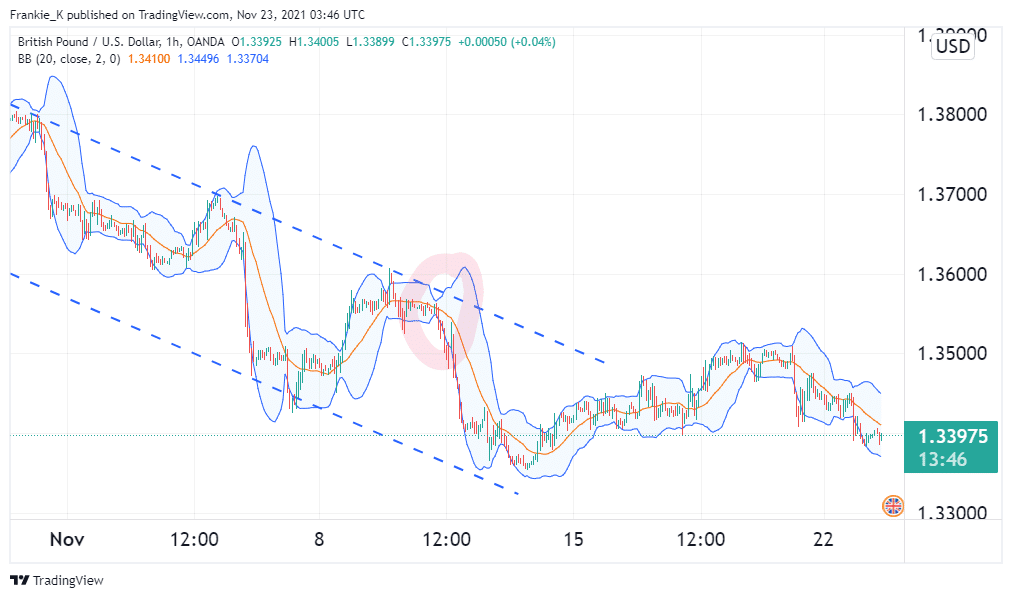
Using Bollinger Bands, we were able to obtain an entry signal when prices approached the period’s resistance level and the bands narrowed. This is shown by the highlighted area. Usually, this signifies the beginning of a trend. From our trading bias, we know it is most likely going to be a bearish trend. Therefore, this is the signal to enter a short trade. The exit signal will be when prices cross above the middle band of the indicator, which is usually a 20-period MA.
Conclusion
The Cable is among the most traded pairs in the global FX market. It is characterized by high liquidity and high trading volumes. Due to the strength of their economies, both currencies in the pair are favored by many as safe currencies. Further, the abundance of economic information on them makes them an easy option for traders. For best results, it is wise to utilize multiple timeframe analysis when trading this pair.