Any speculative trader worth their salt will tell you that it is always wise to trade in the direction of the trend. However, following a trend is not for the faint of heart. However strong a trend may seem, it will always be marked by frequent price pullbacks that eat into your profits. Sometimes they last a little while before resuming the original trend, while other times, they disqualify the prior trend altogether. The question then becomes how to tell the difference before your indecision drives you to losses. In the words of Marcus Cicero, more is lost by indecision than a wrong decision.
About retracements
A retracement refers to a temporary price pullback that occurs in the middle of a trend. Usually, retracements will last a short time, and they almost always revert back to the original trend. For instance, if a currency pair or cryptocurrency was in an uptrend, a retracement would manifest as a slight decline before the pair resumes its rally.
Similarly, if the asset was in a downtrend, a retracement would appear as a short-lived spike in prices, followed by a resumption of the downtrend. This is colloquially referred to as a dead cat bounce. You can think of it as a dead cat falling off a roof but then hitting a branch on a tree on its way down. When it hits the branch, it will most likely bounce before resuming the plunge to the ground.
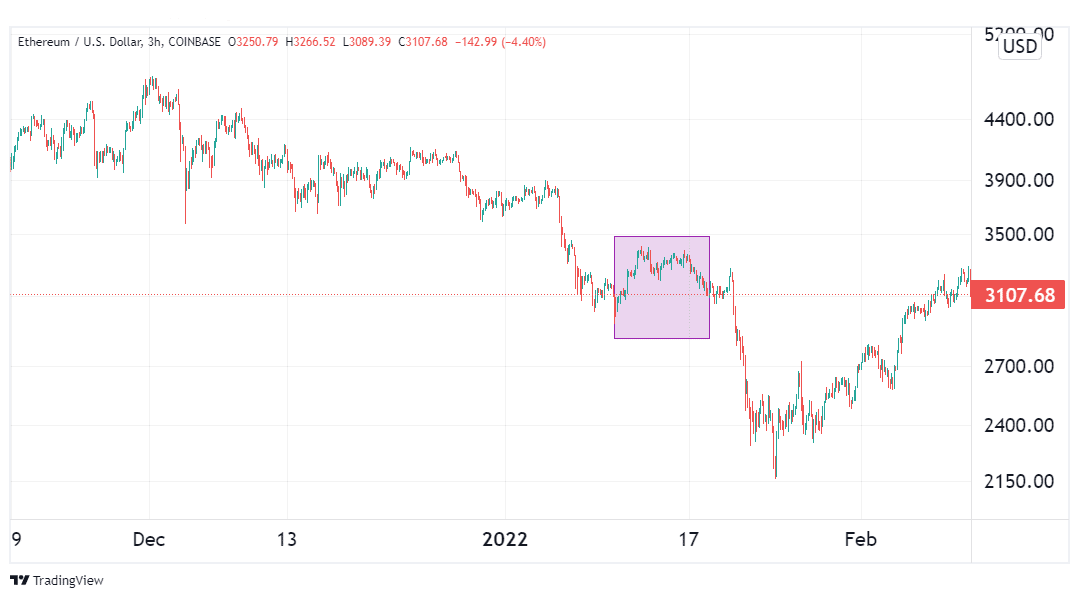
The illustration above shows a retracement in the Ethereum price chart. The token was in a downtrend when it manifested an upward pullback. Shortly after, the prevalent downtrend was resumed. This is an example of a dead cat bounce retracement.
On the other hand, the image below shows a retracement during an uptrend.
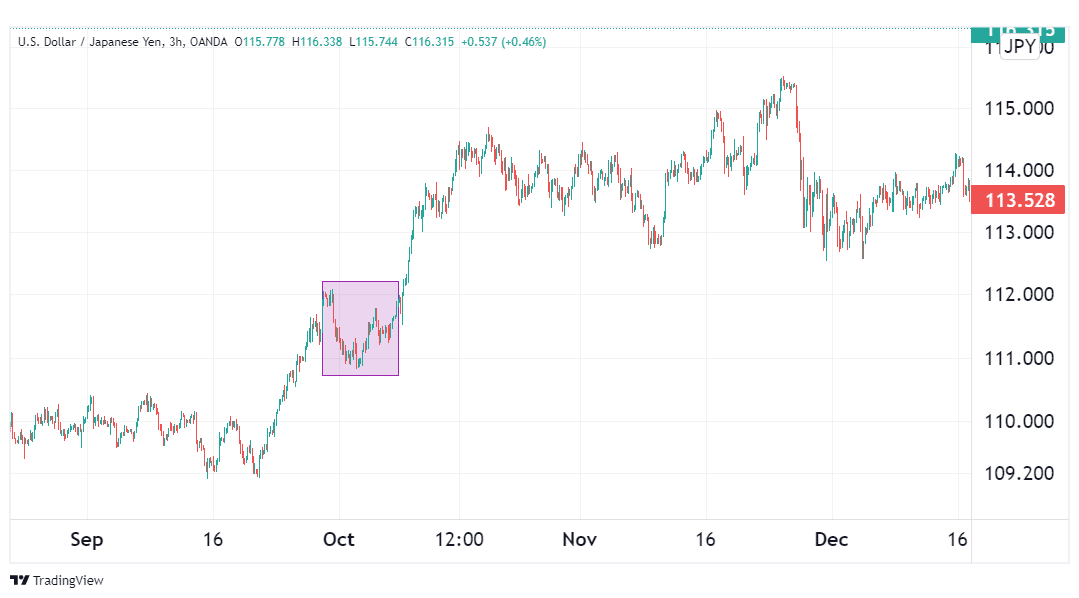
As is evident from the chart, the USDJPY pair was in an uptrend when around October, it manifested a price decline. Shortly afterward, the pair resumed its prior upward trend.
About reversals
A reversal refers to a complete change in the direction of the price movement of a financial asset. The direction taken by the market doesn’t matter – a reversal can occur during an uptrend or downtrend. If a currency pair or cryptocurrency was rallying, a reversal would send it plunging downwards for a prolonged period. Similarly, if the asset was in a downtrend, a reversal would turn it bullish.
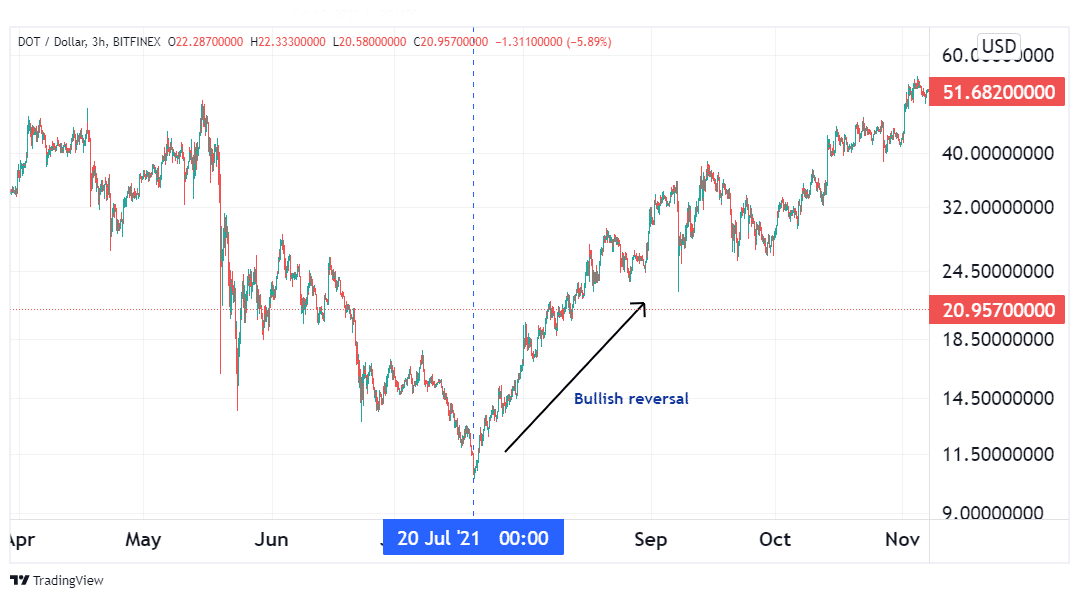
The illustration above shows an example of a reversal on a DOT price chart. Since mid-May, this native coin of the Polkadot network was declining against the dollar. On 20th July, however, the trend changed, and the token went on a sustained rally. This is referred to as a bullish reversal. It follows then that a bearish reversal would be the opposite – an uptrend turning into a sustained price decline. Such a scenario is shown in the image below.
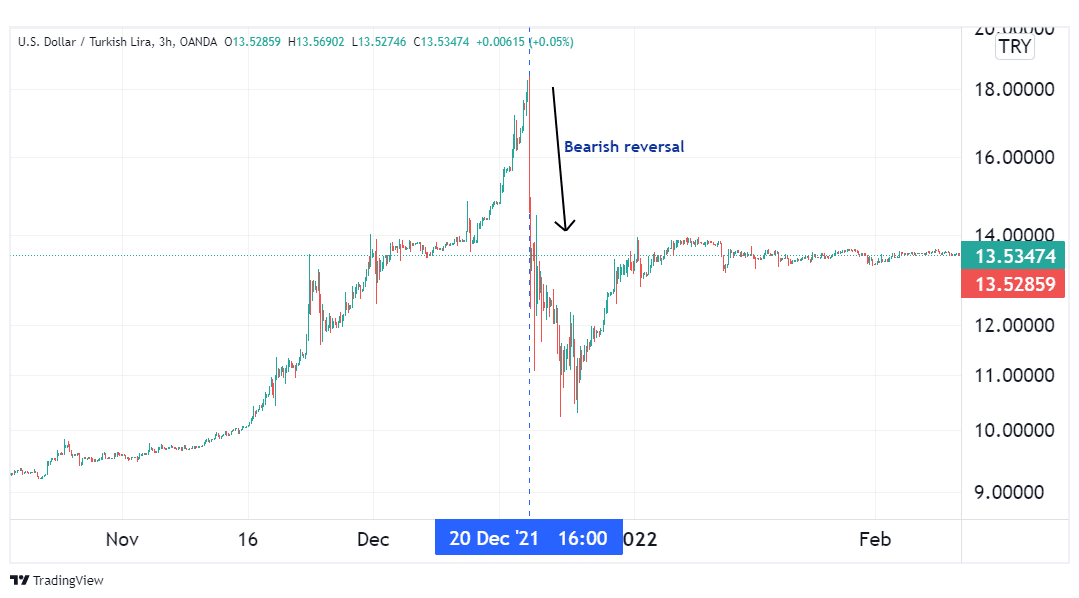
In the above illustration, the USDTRY pair had been in an uptrend since November of 2021. However, come 20th December, the pair went on a sharp decline. This marked the change of trend from bullish to bearish. This is called a bearish reversal.
How to tell the difference
When trading a trend, oftentimes, you’ll be faced with price pullbacks in the opposite direction. It is important to tell whether such a pullback is likely to be a reversal or just a retracement of the current trend.
Let’s assume you were going long on a pair, for example, and a pullback occurred. If the pullback is just a retracement, then you would be wise to stick to your guns until the prior uptrend resumes, bringing you back into the profit-making territory. However, if the pullback turns out to be the beginning of a reversal, you should exit your trade as soon as possible before the market eats into the entirety of your profits.
There are several ways of identifying potential reversals and retracements. They include:
Using trendlines
From the chart below, we see the GBPJPY in a prolonged downtrend since mid-October. While this trend persisted, prices staged multiple pullbacks that tested the support level.
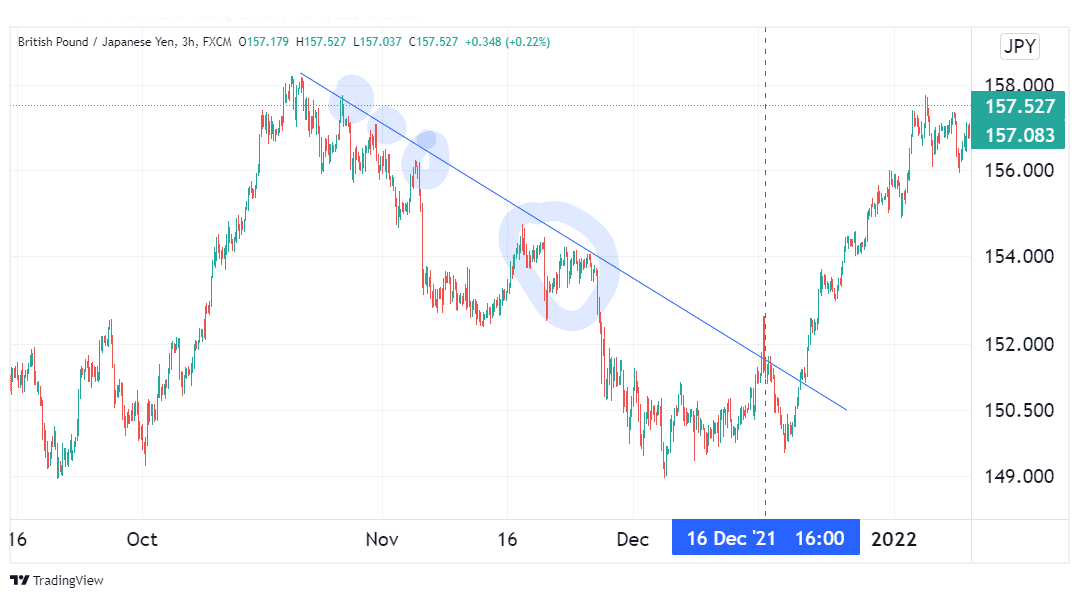
As is evident from the highlighted areas, the resistance level held against these pullbacks, rendering them temporary retracements.
However, on 16th December, the first pullback broke past the trendline. Though it turned out to be a false breakout, this was a sign of an impending reversal. True to the signal, a few days later, prices broke past the trendline again to embark on a sustained rally, marking a complete change in trend.
Using the Fibonacci retracement tool
A Fibonacci retracement is a tool that consists of several likely levels where prices may retrace to before resuming their prior trend. The most common levels to watch for are 38.2%, 50%, and 61.8%. If pullbacks fail to go past these levels, then they can be ruled as temporary retracements. However, any pullback that goes past the 61.8% level more often than not turns out to be a reversal.
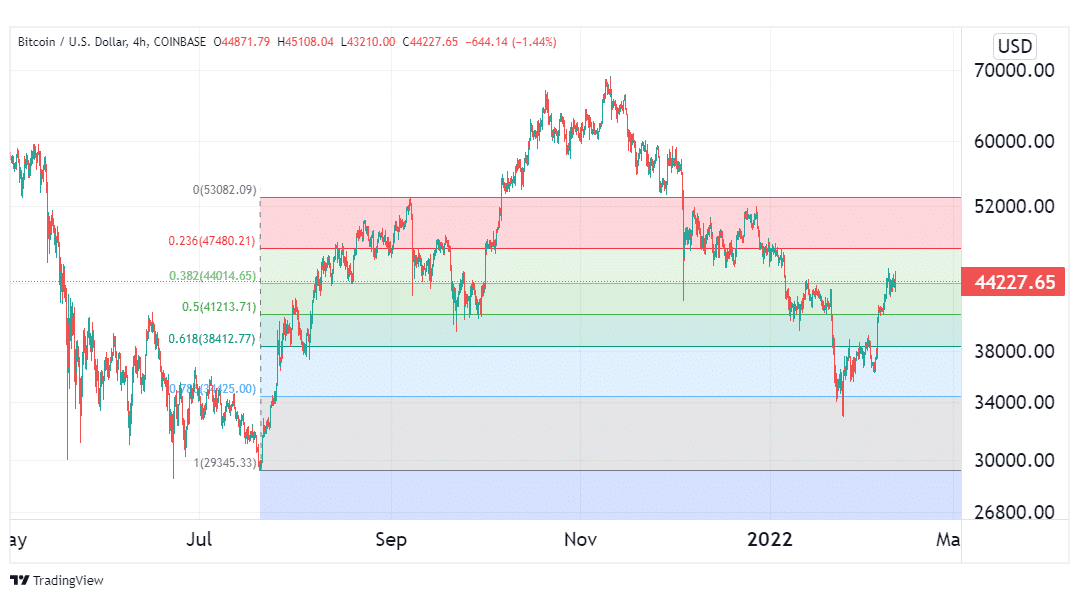
In the image above, rallying Bitcoin prices staged a pullback that was reversed at the 50% fib retracement level. This meant it was just a retracement, and the prior trend soon resumed. However, if this pullback had broken below the 61.8% level, we would have ruled it as a reversal.
Conclusion
A retracement is a temporary price pullback against the direction of the current trend. Such a pullback is often short-lived, and the prior trend soon resumes. A reversal, on the other hand, is a complete change in the direction of the prevalent trend. To identify whether a pullback is a retracement or a reversal, you can use support or resistance trendlines or the Fibonacci retracement tool.