A trend is an environment in which the market primarily moves in a certain direction. The trends can be long-term, short-term, upward, and downward. The trend can deviate off and then return to its original path.
Overall, the Elliott Wave Theory provides useful information that can aid technical analysts in tracking and understanding the short and long-term changes of financial asset values. According to the theory, both impulse and corrective waves occur over all scales and timeframes as components of a hierarchy fractal. There are three types of corrective waves: zigzag, triangle, and flat.
What is a correction?
Such a move occurs when the market goes contrary to the primary trend for a brief period. In a bullish trend, a correction will be bearish, while in a bearish trend, it will be bullish.
Corrections often happen when the market is overbought or oversold, as indicated by oscillator readings. There’s also what’s known as a horizontal correction, known as a sideways market or range. It occurs when the demand for a specific asset is equal to the supply of that asset.
What are correction waves?
Correction waves are either simple or complex; the only difference is that complex ones involve at least an x-wave or an intervening x-wave. If a corrective wave is simple, the market can only form one of three possible patterns. Elliott discovered that when the market is corrected, it creates a zigzag, a flat, or a triangle.
Types of correction waves and how to trade them
Triangle
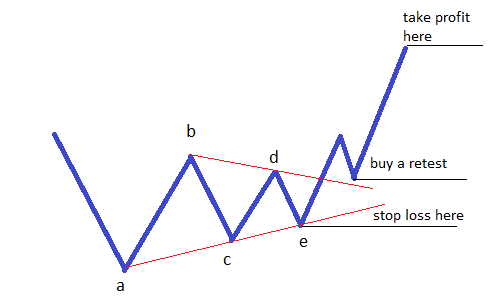
This is the most common corrective wave. A triangle will most likely form if consolidation is going to form. Triangles that are contracting are the most prevalent, and this gives us a way to trade them. Even though the actual pattern has five legs: a–b–c–d–e, any triangle has a three-wave structure. The concept is that each leg is a corrective one or a three-wave structure of a lower degree, and as a result, the entire pattern is considered corrective.

When trading triangles, it’s important to pay attention to when the b–d trendline is broken. A retest of the b–d trendline usually follows such a break, and this is the time to enter a trade with a stop loss at the triangle’s end. The length of the setup’s longest leg projected from the break of the b–d trendline can be used as a standard take profit. However, because the price frequently explodes once the triangle is broken, this is considered a conservative method.
Zigzag
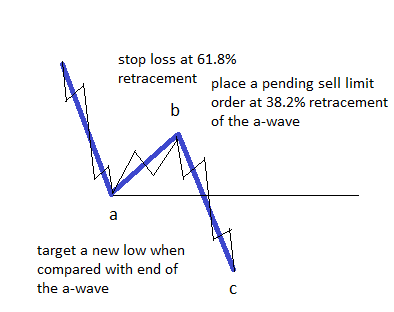
Zigzags, commonly known as three-wave structures, are simple corrective waves. The structure is 5–3–5, and the labeling typically is a–b–c. The a- and c-waves have a five-wave structure, while the b-wave has a three-wave structure. It also denotes impulsive waves for waves a and c, as well as a corrective structure for wave b. The retracement level for the b-wave is crucial in deciphering a zigzag.
When trading the zigzag, the retracement level must be less than 61.8 percent, and this offers us the trading tools we need to locate the proper entry, stop loss, and target.

The aim is to enter the market or put a pending order when the price retraces more than 38.2 percent of the a-wave. This essentially suggests that we’re trading the b-retracement wave’s level. An entry like this can also be broken into many entries. For example, if one wants to trade one lot, it is best to sell half of it at 23.6 percent and the remainder at 38.2 percent (in a bearish zigzag).
A conservative target for the trade should be a new low below the end of the a-wave (in a bearish zigzag), as this is essential in a zigzag. This target should only be used if the b-wave retracement level is greater than 38.2 percent and the a-wave is in the 50 percent range. Otherwise, trading it for this aim is pointless because the reward is so little. On the other hand, aggressive traders can aim for a move that is equal to the length of the a-wave, as this is what most zigzag patterns do.
Flat
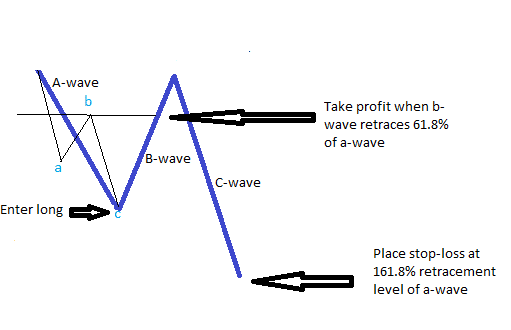
The flat type contains an a-b-c formation. When compared to the length of the previous A-wave, we can have a retracement of more than 80 percent, 100 percent, or even more than 161.8 percent depending on the type of flat pattern the market creates.
We can trade the B-wave based on the structure of the A-wave since the former must retrace more than 61.8 percent of the preceding A-wave. The A-wave, which is a corrective wave, might be a zigzag or a lower degree-flat. First, wait until the a-wave is almost complete before fading the move with a trade in the opposite direction. The take profit should be set at 61.8 percent retracement level of the entire A-wave, or a trader can trail this stop moving forward.

The entry should be placed when a lower degree C-wave entirely retraces the previous A-wave. In this case, the stop loss is 161.8 percent of the A-wave. The C-wave rarely exceeds 161.8 percent, which is why you have to place the stop loss that far.
Conclusion
A correction is a price rebound that occurs following each trend impulse. After a correction, the price returns to its previous trend. Elliott discovered that when the market is corrected, it creates a zigzag, a flat, or a triangle. These different corrective waves are traded based on the Fibonacci retracement tool.