TradingView is one of the biggest fintech companies in the world. In 2021, the company raised over $400 million at a $4 billion valuation, making it one of the biggest firms in finance. It has over 100 million users globally.
One of the platform’s most useful features is Strategies, which are robots that execute trades or send signals to traders. This article will explain how to use TradingView strategies and identify some of the best strategies for cryptocurrency trading.
How to use TradingView strategies
First, identify the preferred cryptocurrencies that you want to trade. Examples of the most popular cryptocurrencies are Terra, Ethereum, Cardano, and Polkadot.
The second part is where you click the strategies option. Go to the indicators section and then select the strategies option as shown in the chart below. Finally, navigate to the strategy you want to use and then see its performance.
After selecting the strategy, you have a few options. First, you can run it through the strategy tester to see its performance. This is an important step to test the performance of the bot’s strategy.
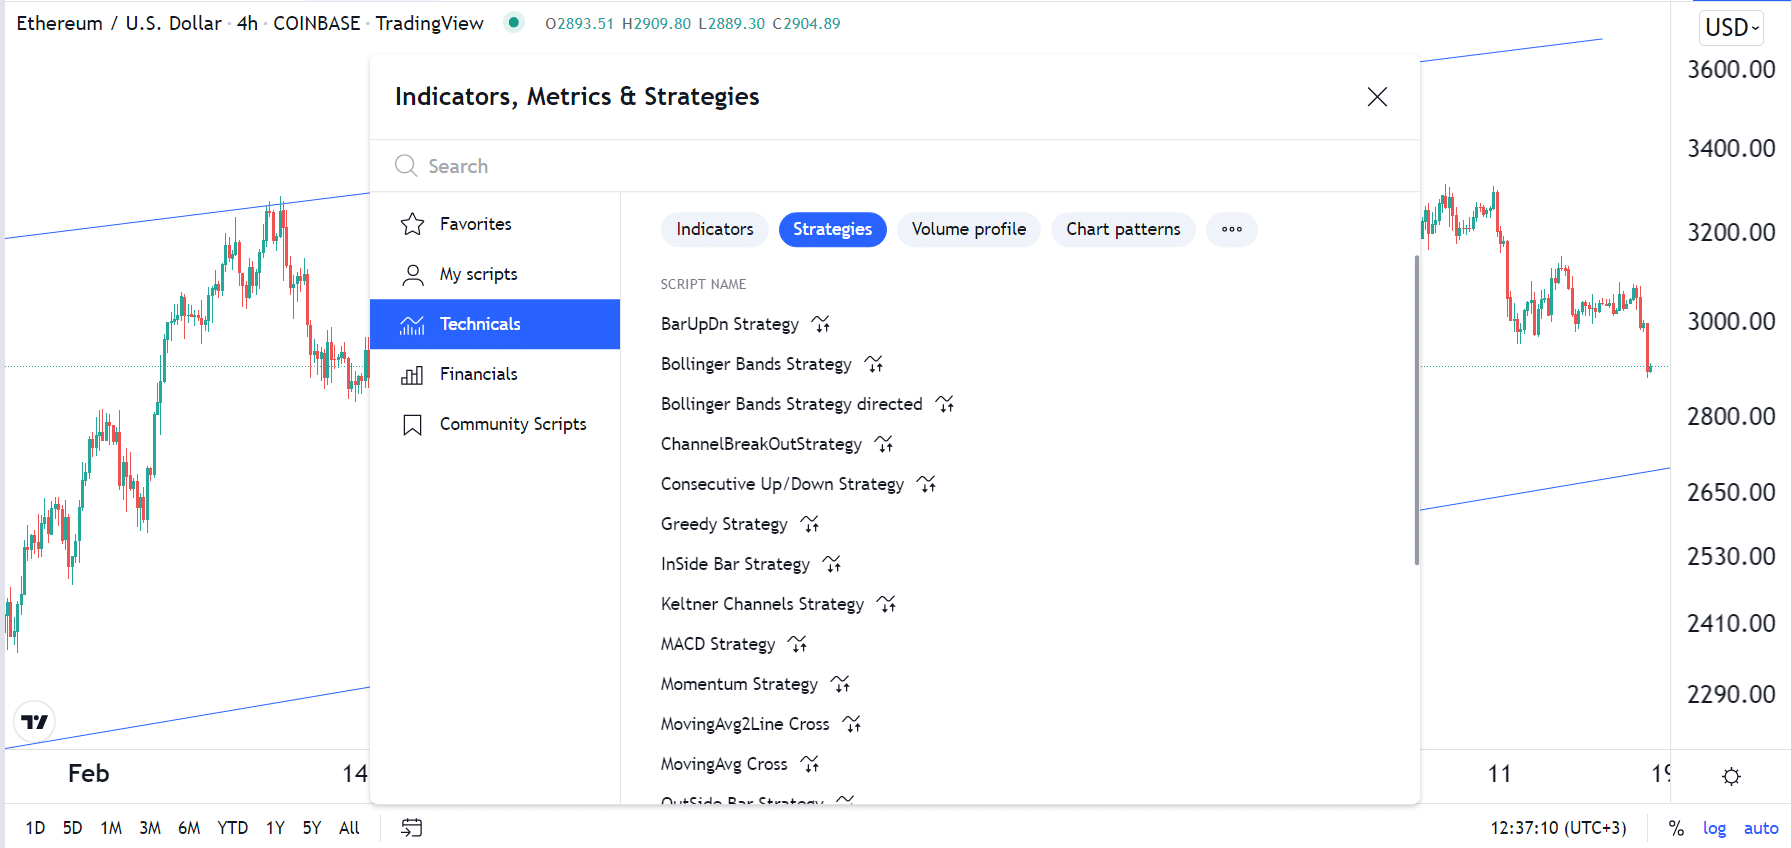
Second, you can tweak the strategy by changing the default data. Some of the top properties that you can change are pyramiding, commission, slippage, inputs, and order sizes. Some strategies will have more input options that you can tweak.
Finally, you can opt whether you want the bot to execute the trades or send you a signal when the characteristics are met. It can send you a signal by notifying you in the application, sending an email message, sending a webhook URL, and even sending an SMS message. With this in mind, below are some of the best TradingView strategies to use.
Consecutive Up/Down strategy
Consecutive Up/Down strategy is a popular trading strategy that has been used for a long time in the financial market. The strategy is commonly used in trading assets like forex, commodities, exchange-traded funds (ETFs), and cryptocurrencies.
In most cases, an asset’s price will continue rising when there is strong momentum. Similarly, the price will continue falling if it declines for several days straight. In most cases, traders use three days.
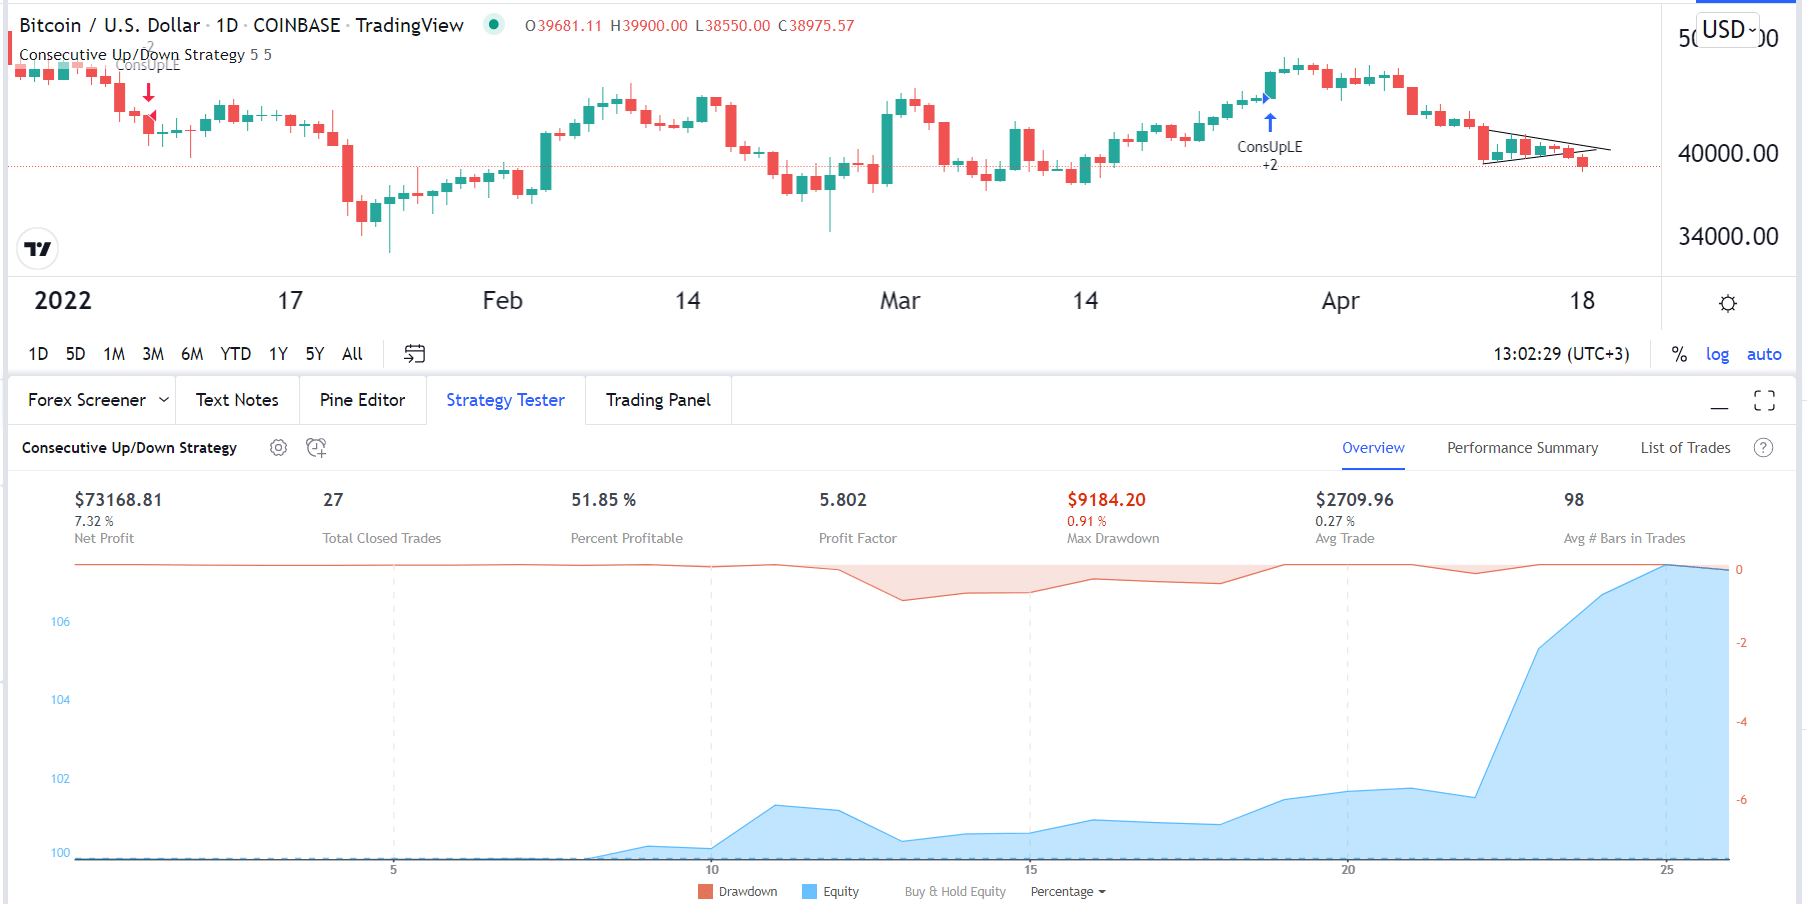
In this case, the consecutive up/down indicator will open a bullish trade when the price rises for X number of days. It will also open a short trade when it declines for X number of days. It is worth noting that the indicator usually looks at candlestick bars. Therefore, if you have an hourly chart, it will execute a buy trade when it rises for X number of hours.
Supertrend strategy
The Supertrend indicator is one of the most popular among advanced traders. The indicator’s goal is to take advantage of existing trends in the market. It is created by first identifying the basic upper band by adding high and low and then dividing the answer by 2. Then, you add the answer by the Average True Range (ATR) X multiplier. The basic lower band is calculated in the same way, although the result is subtracted.
The Supertrend strategy opens a long trade whenever the Supertrend changes its position from being above the chart to below. It then opens a short trade when the Supertrend indicator moves from below to above the chart.
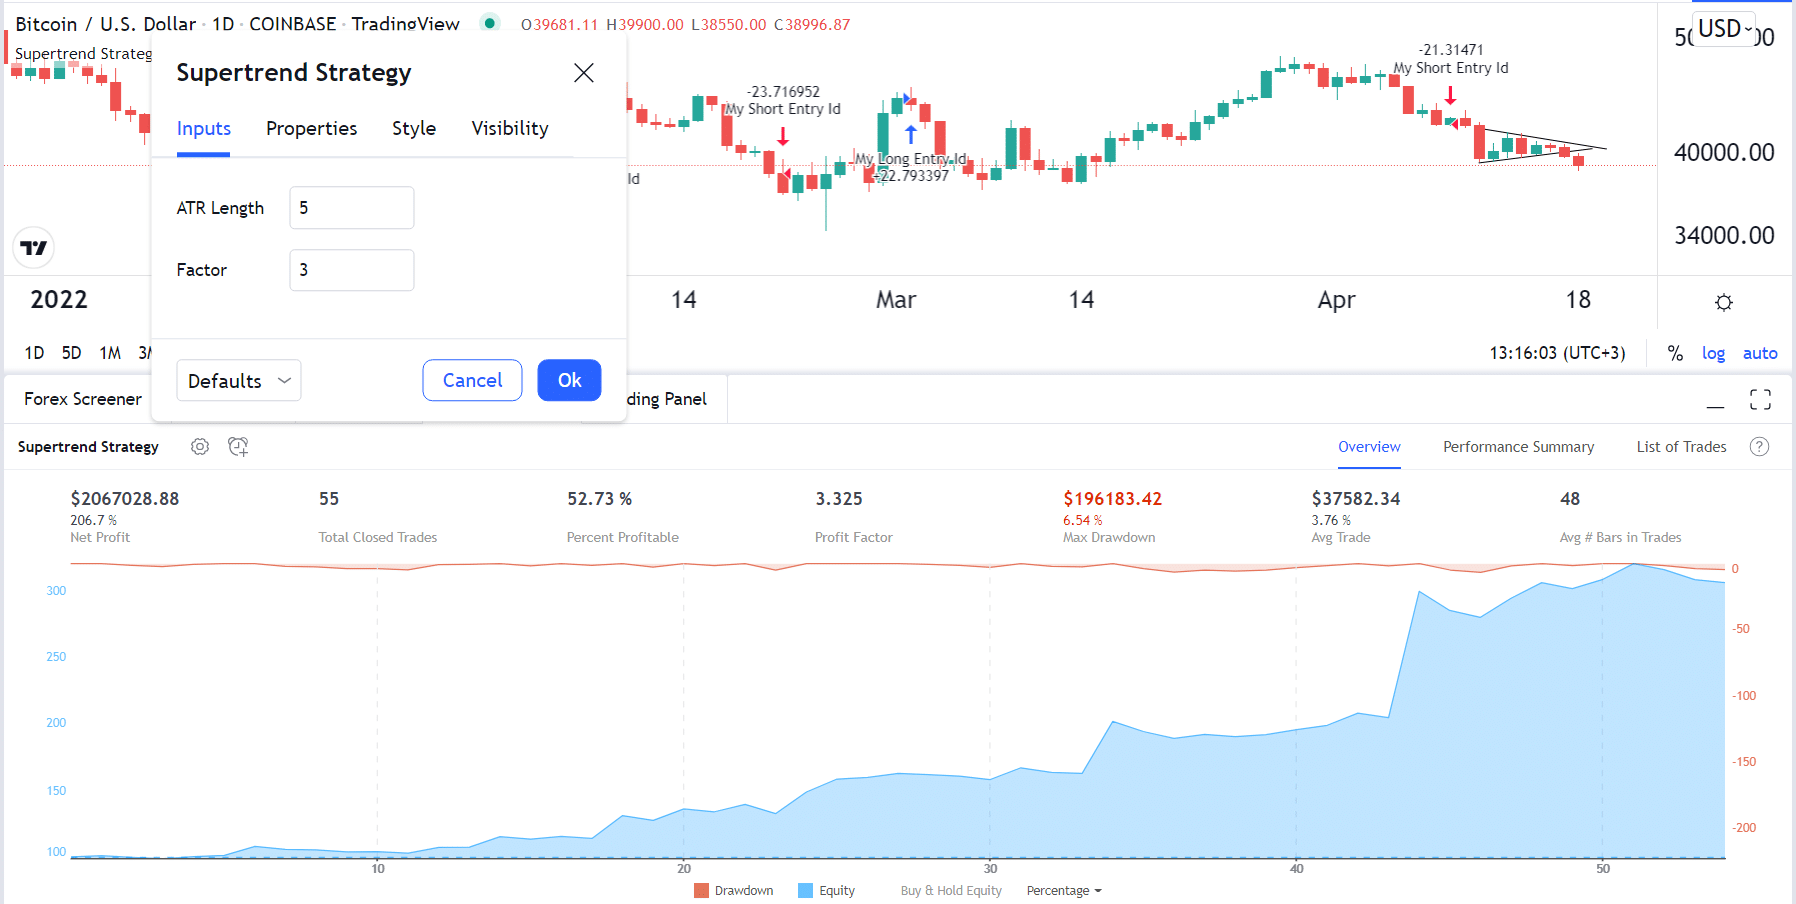
The most important part of this strategy is to change the inputs. In this case, you will need to change the ATR length and the factor. As shown above, with an ATR length of 5 and a factor of 3, the indicator has a profitability percentage of 52.73%.
MovingAvg2Line Cross
Moving Average is one of the most important technical indicators in the world. It is widely used in a number of strategies like trend-following, reversals, crossovers, and in combination with other indicators.
A common approach to using Moving Averages is combining a long and a short one. In this case, your goal is to buy when the two MAs cross one another when the price is at a lower level. One can also short the asset when the crossover happens above the price. These crossovers are known as a golden and a death cross, respectively.
The MovingAvg2Line cross is based on this strategy. It will open a bullish trade when the indicators cross one another.
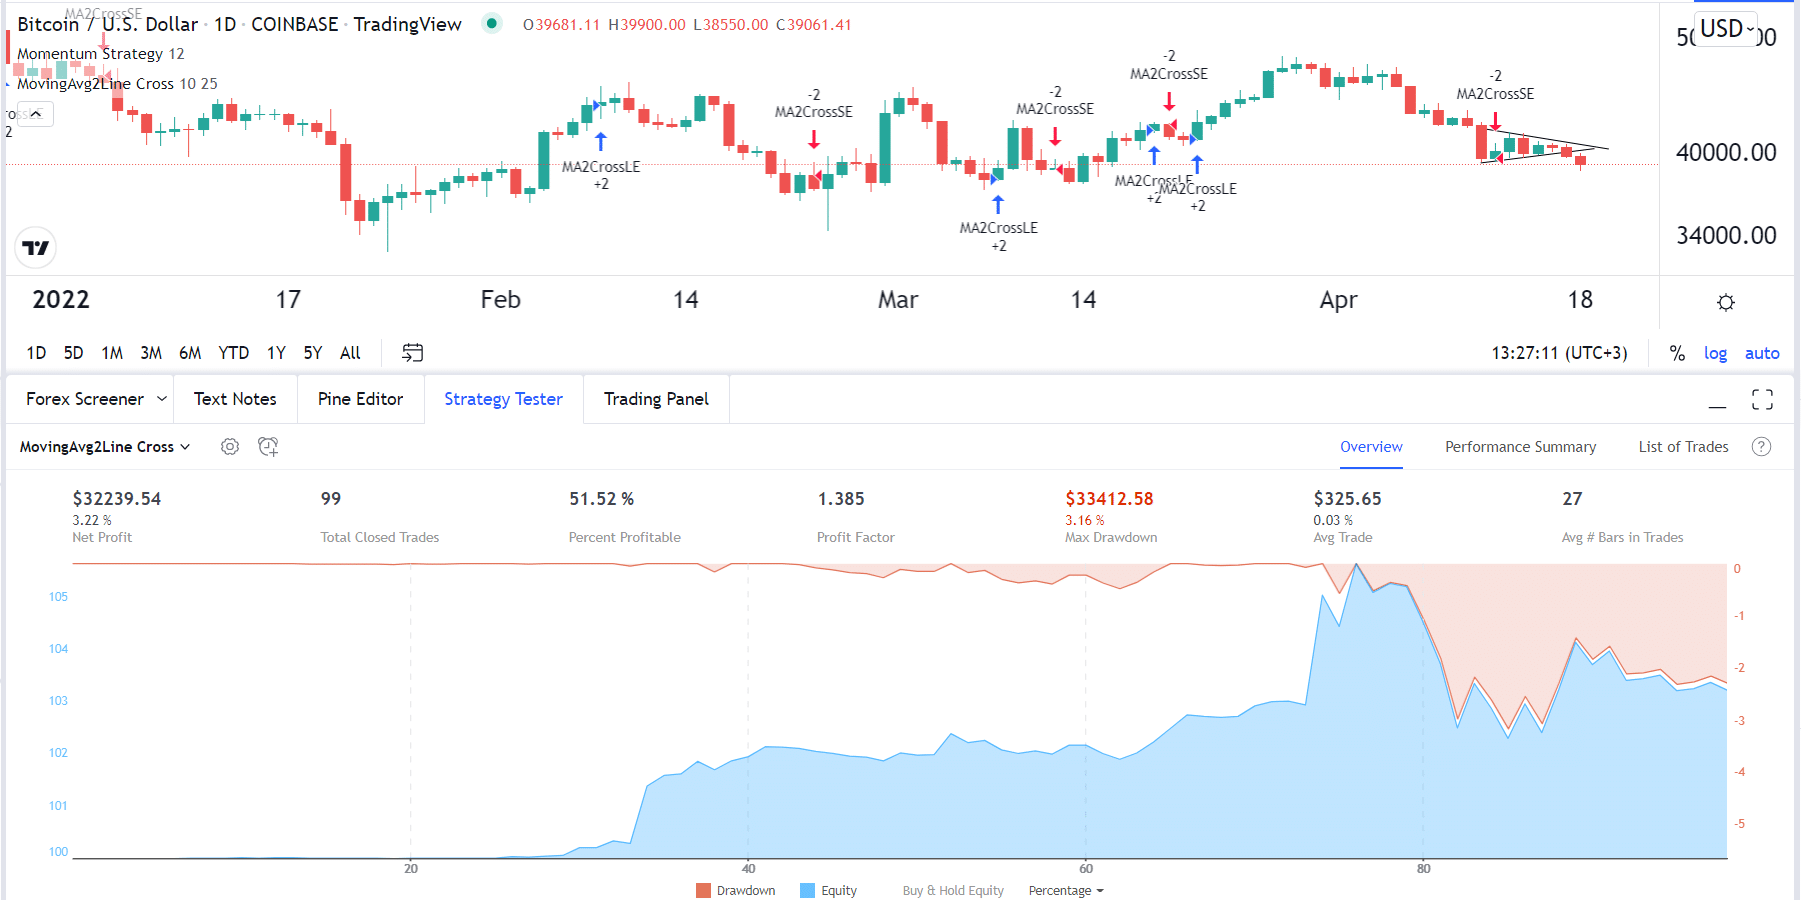
The default period is 9 and 18, although one can tweak this period. The chart above shows the strategy applied on the BTCUSD chart.
RSI strategy
The Relative Strength Index (RSI) is another popular trading indicator. Like the Moving Average, it is used in a number of strategies such as trend-following and finding divergences. One of the most common RSI approaches is finding overbought and oversold levels. In most cases, the oversold level is usually 30, while the overbought is 70.
The RSI strategy does exactly that. It sends an alert when an asset’s price moves to the oversold level and when it moves to the overbought level. Still, most people tend to adjust these levels.
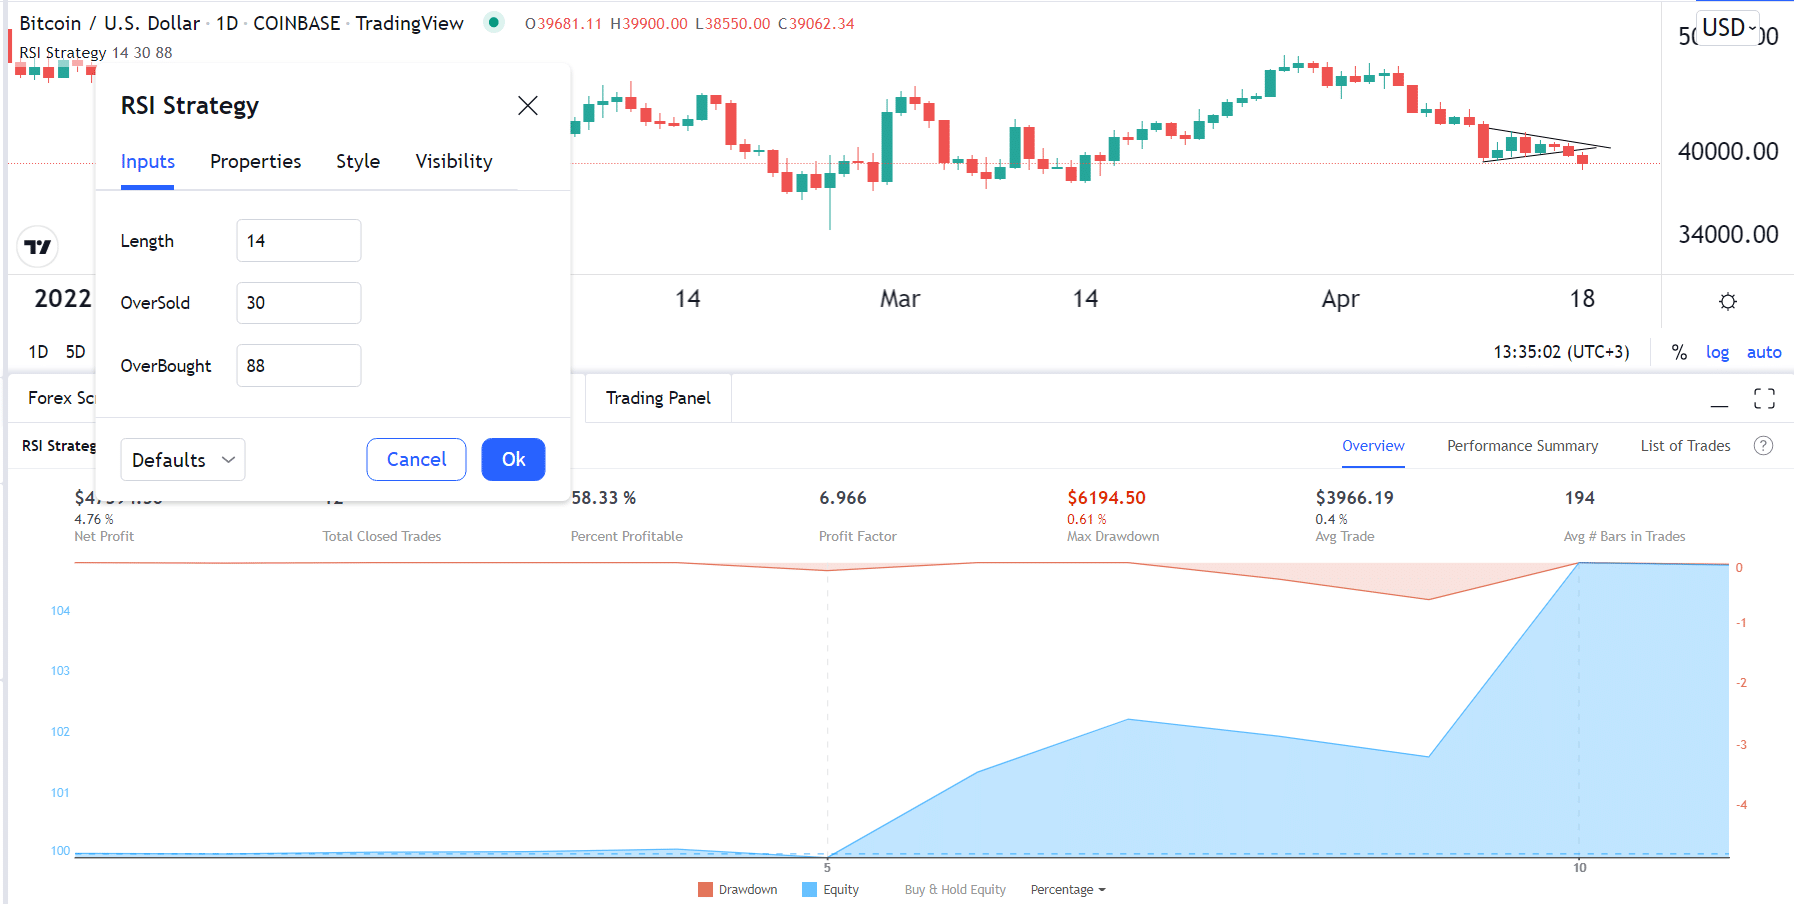
For example, you can set the oversold point at 30 and the overbought point at 88. The chart above shows that such a combination is 70% profitable.
Summary
This article has looked at what TradingView strategies are and how they work. We have also provided some examples of the most popular and top methods that you can use. However, we recommend that you sufficient time testing these strategies before you put your money at risk.