TradingView is probably one of the best charting platforms for a myriad of instruments, including forex. Aside from its highly aesthetic charts and smooth user interface, TradingView also comes with tools or indicators not found on many other software packages.

While the Williams VIX Fix Indicator has been around for ages and is available in different versions with other platforms, it works particularly well on TradingView’s interface. This indicator provides critical information about potential market tops and bottoms, which is highly beneficial for any trader in the markets.
This article will cover what the tool is, where it comes from, how it functions, and provide an example of how investors could use it in forex.
What is the Williams VIX Fix Indicator?
The Williams VIX Fix (WVF) indicator is a modified version of the VIX or volatility index created by the Chicago Board Options Exchange (CBOE) in 1993. To understand the WVF, we need to know how the traditional VIX works.
The VIX represents the market’s forecasts of 30-day price changes in the S&P 500 options. Volatility describes the measure by which prices change over a defined period. The index attempts to gauge market sentiment or, more specifically, the amount of fear in the market.
Hence, some analysts might also refer to the VIX as the fear index or fear gauge. The WVF is credited as the invention of the American stock and commodity trader Larry Williams. Williams created the indicator as the conventional VIX is only available for a few stock indices, namely the S&P 500, Dow Jones Industrial Average, and the NASDAQ Composite.
Therefore, his synthetic version works on virtually all tradeable markets. Research suggests Williams first mentioned the tool in 2007 with an article entitled ‘Active Trader.’ Over time, many traders have made modifications by adding other indicators like moving averages, Stochastic Oscillator, etc.
In the case of TradingView, we have Bollinger Bands. The main premise behind WVF is that investors become fearful about the future and are likely to liquidate their positions at specific turning points. In short, this tool is quite helpful in anticipating possible market tops and bottoms in any market.
How does the Wiliams VIX Fix Indicator work?
Despite the WVF using Bollinger Bands on TradingView, the bands themselves aren’t so important. The WVF measures how close the current market price is to the lowest and highest prices over a specified period. This is typically over 30 days but is adjustable on TradingView.
VIX is an interesting method of understanding market psychology. When the market is in an uptrend, the close is typically near the highs. Conversely, when the price is in a downtrend, the close is usually near the lows. Therefore, the VIX extrapolates all this data over whichever set time the trader uses.
The histogram bars are what is the most crucial aspect of the VIX. At certain turning points, either during an extended period or a consolidation, rising green bars or near-maximum peaks in them suggest traders are fearful, meaning price is likely to change direction.
Thus, the WVF helps traders evaluate the extent of fear, and the higher it is, the more likely sentiment will change. It’s particularly significant on higher time-frames starting from the 4-hour and above.
Like with any indicator, the VIX is no good on its own. It is necessary to utilize the tool with other confluence points like price action, inherent market dynamics, supply and demand zones, etc.
In the following recent example, we’ll begin to see how someone could have used the tool with other confirmation factors.
A recent example of how traders could have used the Williams VIX Fix Indicator
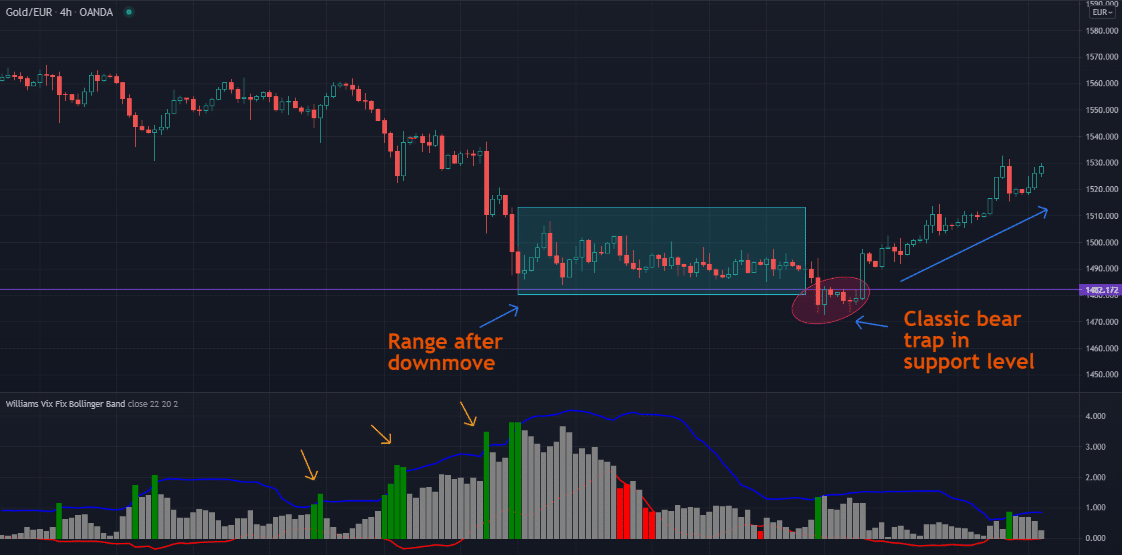
We are looking at the XAU/EUR or gold-euro 4HR chart. After the down move from the 10th of June (which lasted for about a week), the market began consolidating near the highlighted rectangle.

Based on the knowledge of ranges after extended moves, traders understand price is likely to either continue in the same direction or reverse. When the market was in a downtrend, we can see green bars on the WVF began increasing and reached a peak when prices went sideways for roughly ten days.
To some, this might have been considered a demand zone. When the price eventually returned to the low prior to the start of the range, a bear trap emerged. Such a trap is common during consolidations or at points where traders believe a breakout is imminent. In the daily time frame, this would have appeared as a form of engulfing candle.
To summarize, traders could have combined their understanding of sideways markets, zones, higher time-frames, and price action along with the WVF to formulate a solid trading idea.
How to find the Williams VIX Fix Indicator on TradingView
Fortunately, this indicator is available on the basic or free plan of the platform. Below are the steps to find the VIX.

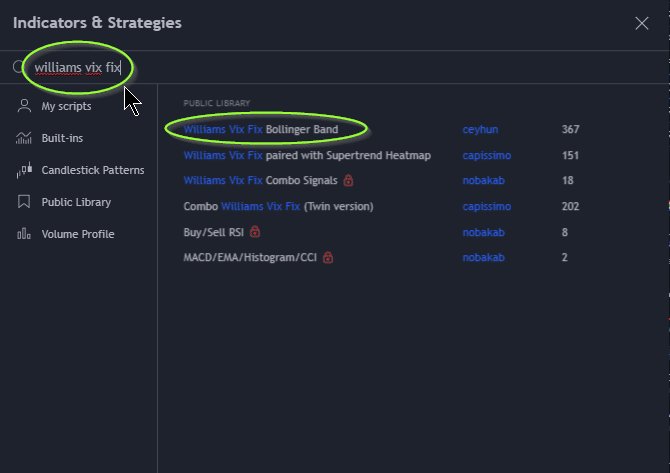
Step 1: After a user has opened a chart, they will go to the top and click on the tab, ‘Indicators.’

Step 2: At this stage, a popup will appear for searching different indicators and strategies. The trader will then type ‘williams fix vix’ into the search bar and select the first option as circled in the image below. After that, the indicator appears at the bottom of the selected chart.
Final word
The Williams VIX Fix indicator is perhaps one of the most powerful tools for understanding how a large group of traders act at certain points based on the inherent market psychology. Like any tool, it is more efficient on higher time frames starting from the 4-hour and above.
Observing this indicator at these charts is a skillful method of anticipating potential big moves from sudden reversals. As with anything, by combining other techniques, the tool becomes more effective and reliable for formulating solid trading ideas.