Multiple timeframes analysis is a top-down approach, helping traders see the market’s overall trend and identify trading bias. This is done by analyzing the larger time frame. The trader can then shift to a smaller time frame to confirm or disprove their bias and obtain opportune entry and exit signals.
Multiple time frame analysis: definition, how it works, and more
Essentially, multi-timeframe analysis is the process whereby a trader observes the same currency pair under different timelines. The larger time frame helps them determine the prevailing trend, while the shorter time frame is used for pointing out ideal entry positions.
The recommended practice is to use a ratio of 1:4 or 1:6 when switching between these timeframes. This is so that you can notice relevant price movements that can point to trend changes and, consequently, potential entry setups.
When the time frames are too far apart, say like the weekly chart to a 5-minute chart, the price movements in the shorter timeframe tend to be filled with too much noise. This can hamper your ability to spot the best entries.
If you choose the hourly chart for your long-term timeframe, you should look for entries in the 15-minute chart (1:4) or the 10-minute chart (1:6). The hourly chart will give you the overall trend, and the 10-minute and 15-minute charts will give you indications of when prices are about to embark on the prevailing trend.
Choosing the right time frame
Essentially, the best timeframe to choose depends on the trading style of each individual trader. Usually, it boils down to how much time you can dedicate to doing your analysis and trading. To this end, there are three types of traders: Long-term traders, day-traders, and scalpers.
For long-term traders who keep their positions open for days at a time, weekly charts can be used for trend confirmation and daily charts for obtaining entry signals. For day traders, the 4-hour chart can provide the underlying trend, while the hourly chart provides entry signals. Scalpers, who keep their trades for a few minutes or few hours only, can benefit from the hourly chart for trends and the 15-minute chart for entry signals.
Multiple time frame trading for long term traders
As aforementioned, long-term traders keep their positions open for days, months, or even years at a time. They are not concerned with short-term fluctuations, and they aim for hundreds of pips in profit. To utilize this technique, they need a long-term chart such as the weekly chart to show them the major trends in the market. Once this trend is obtained, they can then use the daily chart to look for entry signals.
In the example below, we see the EURUSD pair embarked on a bearish trend in 2015. This was confirmed when prices crossed below the 200 period MA. A long-term trader, seeing this, would be looking to open a short position when the time is right.

On the daily chart, we can employ Bollinger Bands to grant us our ideal entry signals. Sure as rain, sometime in August, our pair’s price found resistance on the middle SMA line of the Bollinger Bands and resumed the downtrend.

Further, the Bollinger Bands contracted, which is usually a signal of the beginning of a trend. This gave the entry signal. The middle band could be used as a dynamic stop loss.
Multiple time frames for day traders
A day trader will typically keep their positions open for a few hours, never letting them go unclosed overnight. For such a trader, the 4-hour chart can show the major underlying trend for a currency pair. When the trend is known, the trader can then shift to the hourly chart to obtain entry signals.

In the above example, the GBPUSD pair embarked on a bear run in late September. This was confirmed when prices crossed below the 200 period MA. A trader, seeing this trend, would open a short position when the entry signals align.

In the hourly chart above, we see the GBPUSD pair dropping drastically on the 28th of September. The entry signal to go short was realized when the 50 period MA crossed below the 25-period MA, which is a bearish crossover pattern. A day trader could enter a short trade at this point and wait for prices to cross the shorter-term MA before closing their position, or close it at day’s end, whichever comes first.
Multiple time frame trading for scalpers
Scalpers are traders who fancy the most short-term trades. They keep their positions open for a few minutes or hours until they make a profit and close them. Such traders are concerned with cashing in those short-term price fluctuations.
Scalpers can utilize the hourly chart to see which way the trend is headed. Once they have a direction of bias, they can switch to the 15-minute chart to obtain entry and exit signals.
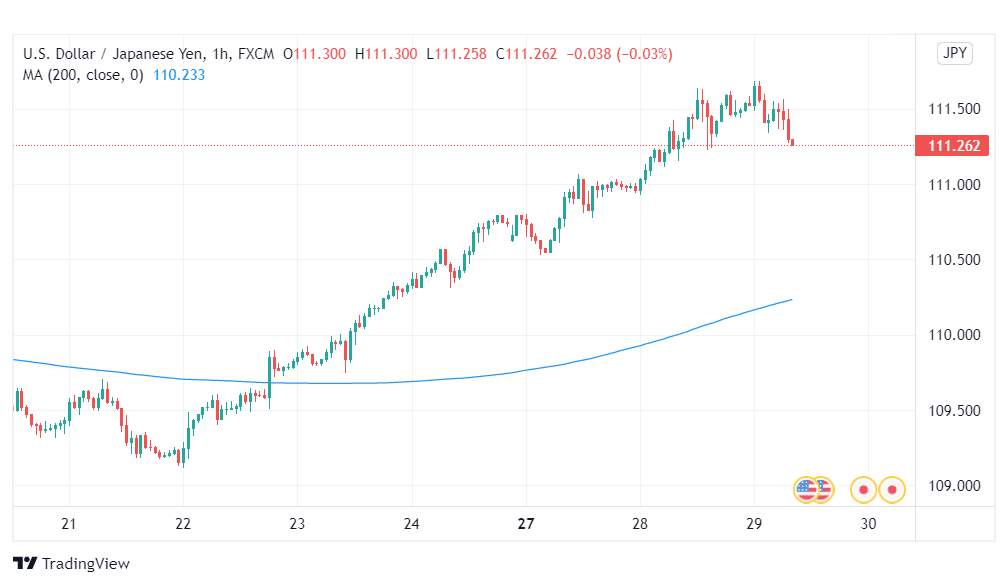

In the example above, the USDJPY pair is in a clear uptrend, which gives the scalper an upward bias. Therefore, such a trader will be looking for the opportune moment to enter a long position.

Switching to the 15-minute chart, we utilize Bollinger Bands to obtain our entry signal. On 28th September, we can see the Bollinger bands narrow after a short period of consolidation, which implies an incoming increase in volatility, giving us the entry signal.
Prices went on a quick uptrend, using the middle band and upper band as support and resistance, respectively. Our exit signal was given when price broke this support and went below the middle band.
Conclusion
The multiple time frame trading approach can help you profit in forex. This is because by observing the major trend on a higher timeframe, you trade in line with the market sentiment. The lower time frame gives you opportune entry points so that you maximize your profit. This increases the chances of your trade being successful.