The most beautiful thing about forex trading is that you gain lots of experience the longer you play in the market. Of course, as you progress, you’ll become a better judge of market activity, but above all, you’ll know which indicators to include in your trading strategy.
If you’re already a professional, you probably know that the best trading strategy includes a well-planned exit strategy. This strategy can never be complete without the means to stop losses or take profit when necessary.
If you’re looking for the indicator to help you protect your profits better, parabolic SAR is the answer. Today, we examine how this indicator works and find out, through an illustration, how it provides cover to your positions.
Parabolic SAR explained
Although not as widely known and used as indicators like the Relative Strength Index (RSI), parabolic SAR is a powerful trading tool designed to trail a forex pair’s price action. It is a trend following indicator and stays its course as long as the trend extends over time.
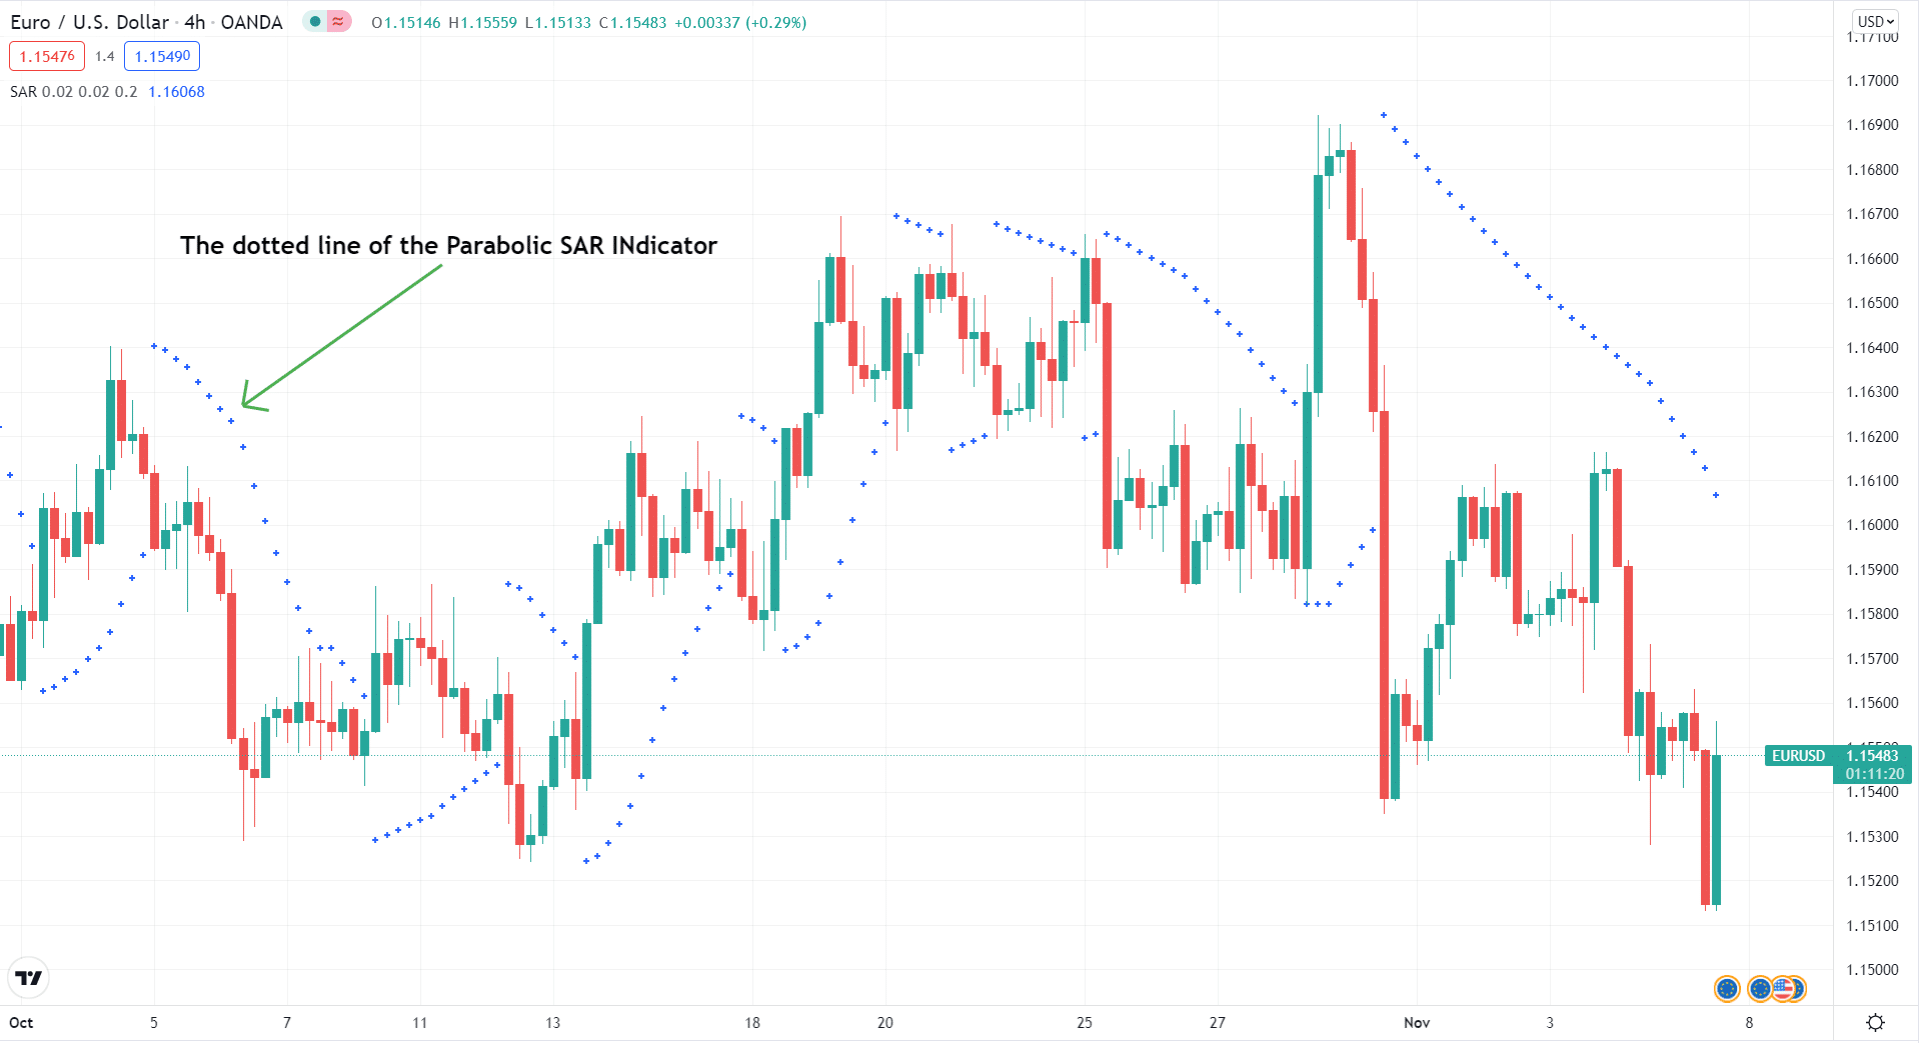
But it is its behavior during trend reversal that defines Parabolic SAR’s unique behavior. For example, the indicator appears below price action in a trending market. When the trend corrects downwards, the indicator stops and reverses its position: now it appears on the upper side of price action.
Did you notice something exciting in the paragraph above? Remarkably, the indicator derives its name from its behavior in a trend reversal – it “stops and reverses” (SAR). So, its full name is Parabolic Stop and Reverse.
Even more exciting is the fact that the indicator’s creator, John Welles Wilder, is also responsible for other indicators, such as RSI, Average Directional Movement (ADX), and Average True Range (ATR). A trained mechanical engineer, Wilder unveiled all the indicators in a 1978 book that is almost like a bible to most technical analysts today. You have to keep in mind that the indicators predate computers, but they are an integral part of the computerized trading of today.
How the indicator works
Before we get into the details, it helps to understand the concept of SAR sensitivity. Here, sensitivity refers to the rate of the indicator’s change relative to price fluctuations. When Welles Wilder created the indicator, he set 0.02 as the default rate of change, also called the step.
It means the indicator changes by 2% for every unit change in price action. So, for example, a dot would be placed at a price 2% higher than the previous dot if the market keeps the current pace when trending upwards.
So, the smaller the step (rate of change), the less sensitive the SAR. It gets more sensitive as you ratchet the step up. According to the book – New Concepts in Technical Trading Systems – in which Wilder unveiled Parabolic SAR, the maximum allowable step is 0.20 or 20% sensitivity to a unit change in price action. Raise the step any higher, and the indicator will produce whipsaws.
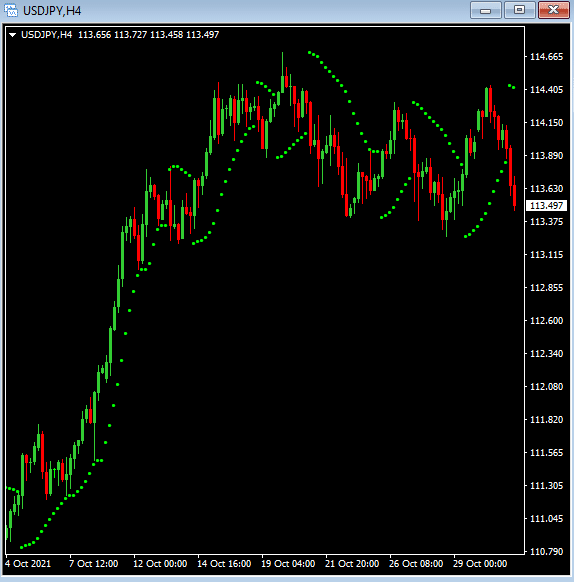
So, let’s see an illustration of how the indicator works with all values set to default. By default, the step is 0.02, and the maximum is 0.2. With these settings, the H4 USDJPY price chart appears as shown below.
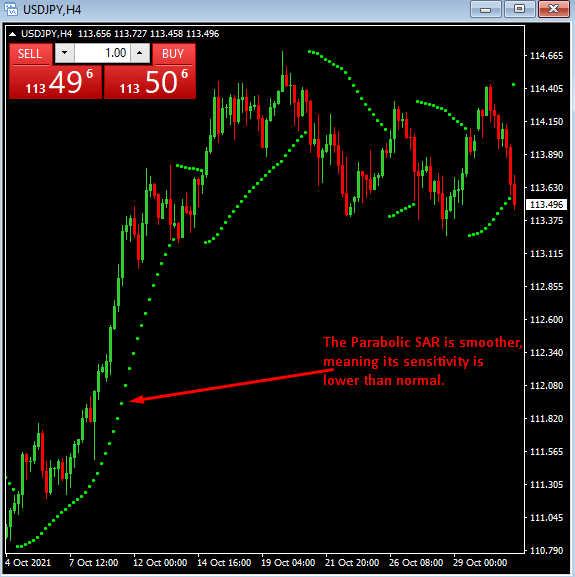
The same chart with different variable inputs (for example, changing the step to 0.01 and the maximum to 0.1) shows interesting behavior by indicator. See the chart below.
Obviously, the indicator would appear haphazardly strewn about the price action if we ratcheted up the sensitivity past the recommended values. So let us see how the chart would appear.
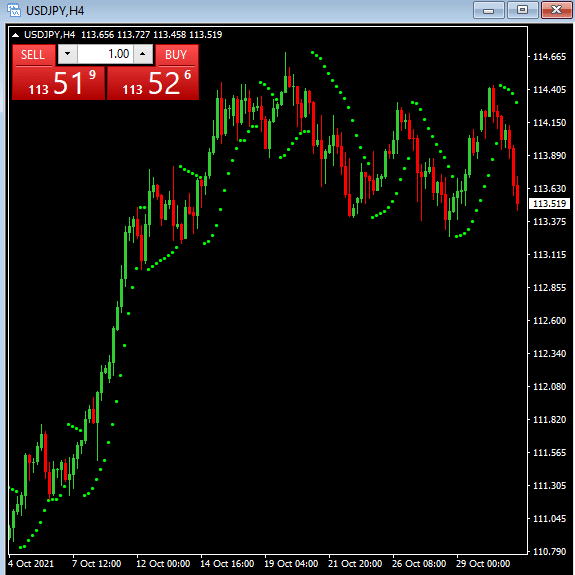
As predicted, the SAR is now more erratic when we push up the step to 0.03 and the maximum to 0.3.
A few things pop out of the above illustration: you can increase or decrease SAR’s sensitivity by adjusting the step and maximum variables; a more sensitive SAR is likely to reverse and unlikely capture the trend accurately, leading to whipsaws.
How to trade using parabolic SAR
The parabolic SAR is more effective in a steadily trending market. Otherwise, it would generate signals that are too erratic to follow.
If you may recall, we mentioned earlier that the indicator trails price action. The series of dots representing the indicator graphically appear below price action in an up-trending market and above it in a down-trending market.
Given the properties, you could use parabolic SAR to define a trailing stop for open positions. Let’s see an example.
In the chart below (one-hour price chart), the EURUSD pair corrected suddenly after the last dot (pointed with a red arrow).
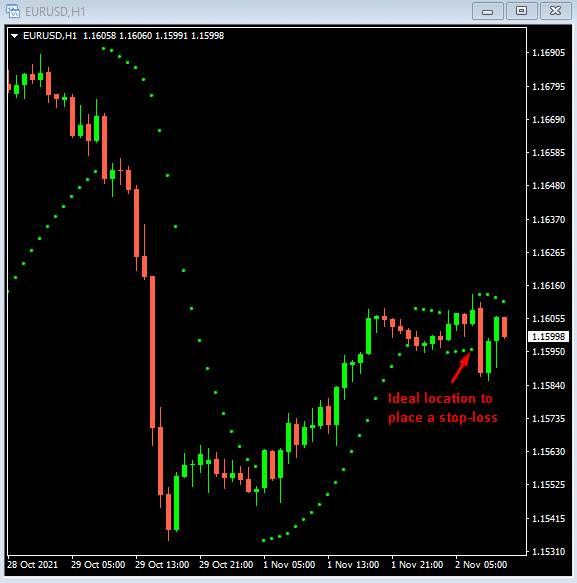
If examined carefully, you’ll notice that the market threatened to reverse course once but carried on with the uptrend. However, there was no way to know the sharp downward swing would have happened, hence where to place the stop loss.
Thankfully, parabolic SAR trails price action and each dot’s location is an ideal stop-loss price. So, when the dot changes location to the upper side of price action, the indicator tells you to exit the position because of an oncoming trend reversal.
Conclusion
As with all indicators, you cannot rely on parabolic SAR for 100% of your trading decisions. The indicator is capable of producing false signals, primarily in a ranging market. As such, it helps to polish your interpretation skills to avoid whipsaws. More importantly, learn to confirm trade setups using other indicators – the Average Directional Movement Index (ADX) could help confirm the trend before launching parabolic SAR.